Project Update: New Website
This page is no longer being updated.
I am in the process of transferring all existing posts to Greek America by the Numbers, where new analyses will also be published:
https://www.greekamericabythenumbers.com
I hope you will visit the new site.
People reporting Greek origin in response to the race question in the 2020 Census.
For the 2020 Census, individuals could offer a written response to the race question, offering a more detailed and nuanced understanding of race and ethnicity. Such information is contained in the Detailed Demographic and Housing Characteristics File A (DHC-A), recently made publicly available, offering population counts and age-specific data on various racial and ethnic groups and for American Indian and Alaska Native tribes and villages.
This post discusses the results of those who indicated “Greek” as their detailed response to the race question for the nation, by state, and by counties. For each geographic category, two tables are presented: one for those indicating 'Greek origin alone' and another for 'Greek origin alone or in combination.' The former represents the smallest count of individuals who self-identified as exclusively Greek, while the latter includes the highest count of individuals who identified with that specific group, i.e., Greek, which consists of those who reported only one response and multiple responses.
Table 1 shows the percentage of people reporting 'Greek origin alone and in combination with other races by state. Here's a summary of the key findings:
- The total number of people reporting ‘Greek origin alone’ and ‘Greek origin alone in combination with other races’ in the U.S. is 577,517 and 1,305,860, respectively.
- New York State leads in 'Greek alone' and 'Greek alone or in combination' categories, with the top 10 states collectively representing over 60% of the total sample reporting Greek origin.
- The state with the highest percentage of people reporting Greek origin alone is New York at 15.6%, followed by California (9.6%), Illinois (8.5%), Florida (7.8%), and Massachusetts (6.6%).
- When considering Greek origin either alone or in combination with other races, New York still leads with 12.0%, followed by California (10.7%), Illinois (7.7%), Florida (6.9%), and Massachusetts (6.1%).
- The top 10 states for each category, i.e., 'Greek alone' and 'Greek alone or in combination,’ collectively represent over 60% of the total sample reporting Greek origin.

Like Table 1, Table 2 presents the same data but distinguishes it by county. Here's a summary of the key findings:
- Cook County in Illinois and Queens County in New York lead in both categories, reporting ‘Greek alone’ or ‘Greek alone or in combination.’
Although the proportion of those reporting 'Greek alone' is nearly comparable in the above two counties, the same cannot be said for those reporting 'Greek alone or in combination.' (Compare the percentages between Cook and Queens counties for those reporting 'Greek alone' with those reporting 'Greek alone or in combination').
- Among the top 10 counties, New York State accounts for 50% of all the states for those reporting ‘Greek origin alone,’ followed by Massachusetts (2 counties), and Florida, California, and Illinois with 1 county each.
New York State makes up 40% of all states where those reporting ‘Greek origin alone or in combination,’ followed by Illinois (1 county), Arizona (1 county), Massachusetts (2 counties), and California (2 counties).
- Those reporting ‘Greek origin alone or in combination’ appear more geographically dispersed than those reporting ‘Greek origin alone.’
Thank you for taking the time to read. As always, your comments are welcome below, or you can contact me by email at grigoris.argeros@gmail.com.
Top 10 states and region of residence for persons born in Greece, 1980-2021.
The following two tables show the top 10 states of residence for persons born in Greece (Table 1) and the distribution of individuals born in Greece by region (Table 2). Both tables also include the percentage change over that period.
Key findings from Table 1 are the following:
The top 10 states of residence for persons born in Greece have remained relatively stable between 1980 and 2021.
New York has consistently been the top state of residence for Greeks, although its share of the Greek-born population has declined from 26.0% in 1980 to 21.4% in 2021.
Florida has seen the most significant growth in its Greek-born population, with its share increasing from 3.8% in 1980 to 7.4% in 2021.
The “Other States” category has grown significantly as Greeks have dispersed to other parts of the country.
The total Greek-born population in the United States has declined by 21.7% between 1980 and 2021.

Key findings from Table 2 are the following:
The Northeast has seen the largest decline in its Greek-born population.
The Northeast had the largest number of Greek-born people in 1980, with 50.0% of the total population. This share declined to 45.2% in 2021, a decrease of 9.5%.
The South has seen the largest increase in its Greek-born population.
The South had the third largest number of Greek-born people in 1980, with 15.1% of the total population. This share increased to 21.6% in 2021, an increase of 43.2%.

Greek-Americans in NYC defined by birth, ancestry, or both, 1980-2021
The number of individuals who identify as Greek Americans in New York City and are defined by either country of birth (Greece), Greek ancestry, or both is shown in the graph below. It is important to note that these indicators are commonly used but not exhaustive in defining the multidimensional identity of Greek Americans.
One significant finding from the graph is that the number of Greek Americans has decreased since 1980 across all three indicators. For instance, those who indicate Greek ancestry have decreased by about 40% from 1980 to 2021. Additionally, among those identified by birth in Greece or born in Greece with Greek ancestry, the decline is even more pronounced, at 46% and 61%, respectively.
As with all posts, click on the title to leave a comment and/or question on this topic.

Quick table on persons reporting Greek ancestry and those born in Greece (separate calculations)
So I ran a quick table looking at persons with Greek ancestry and those born in Greece between 2010 and 2021, using the 5-year 2020 and 2021 estimates of the American Community Survey (ACS).
The numbers reveal a decrease in both categories, with a 6.5% decrease in persons reporting Greek ancestry and a 6.5% decline for those born in Greece.
The above numbers are worth looking into in more detail.
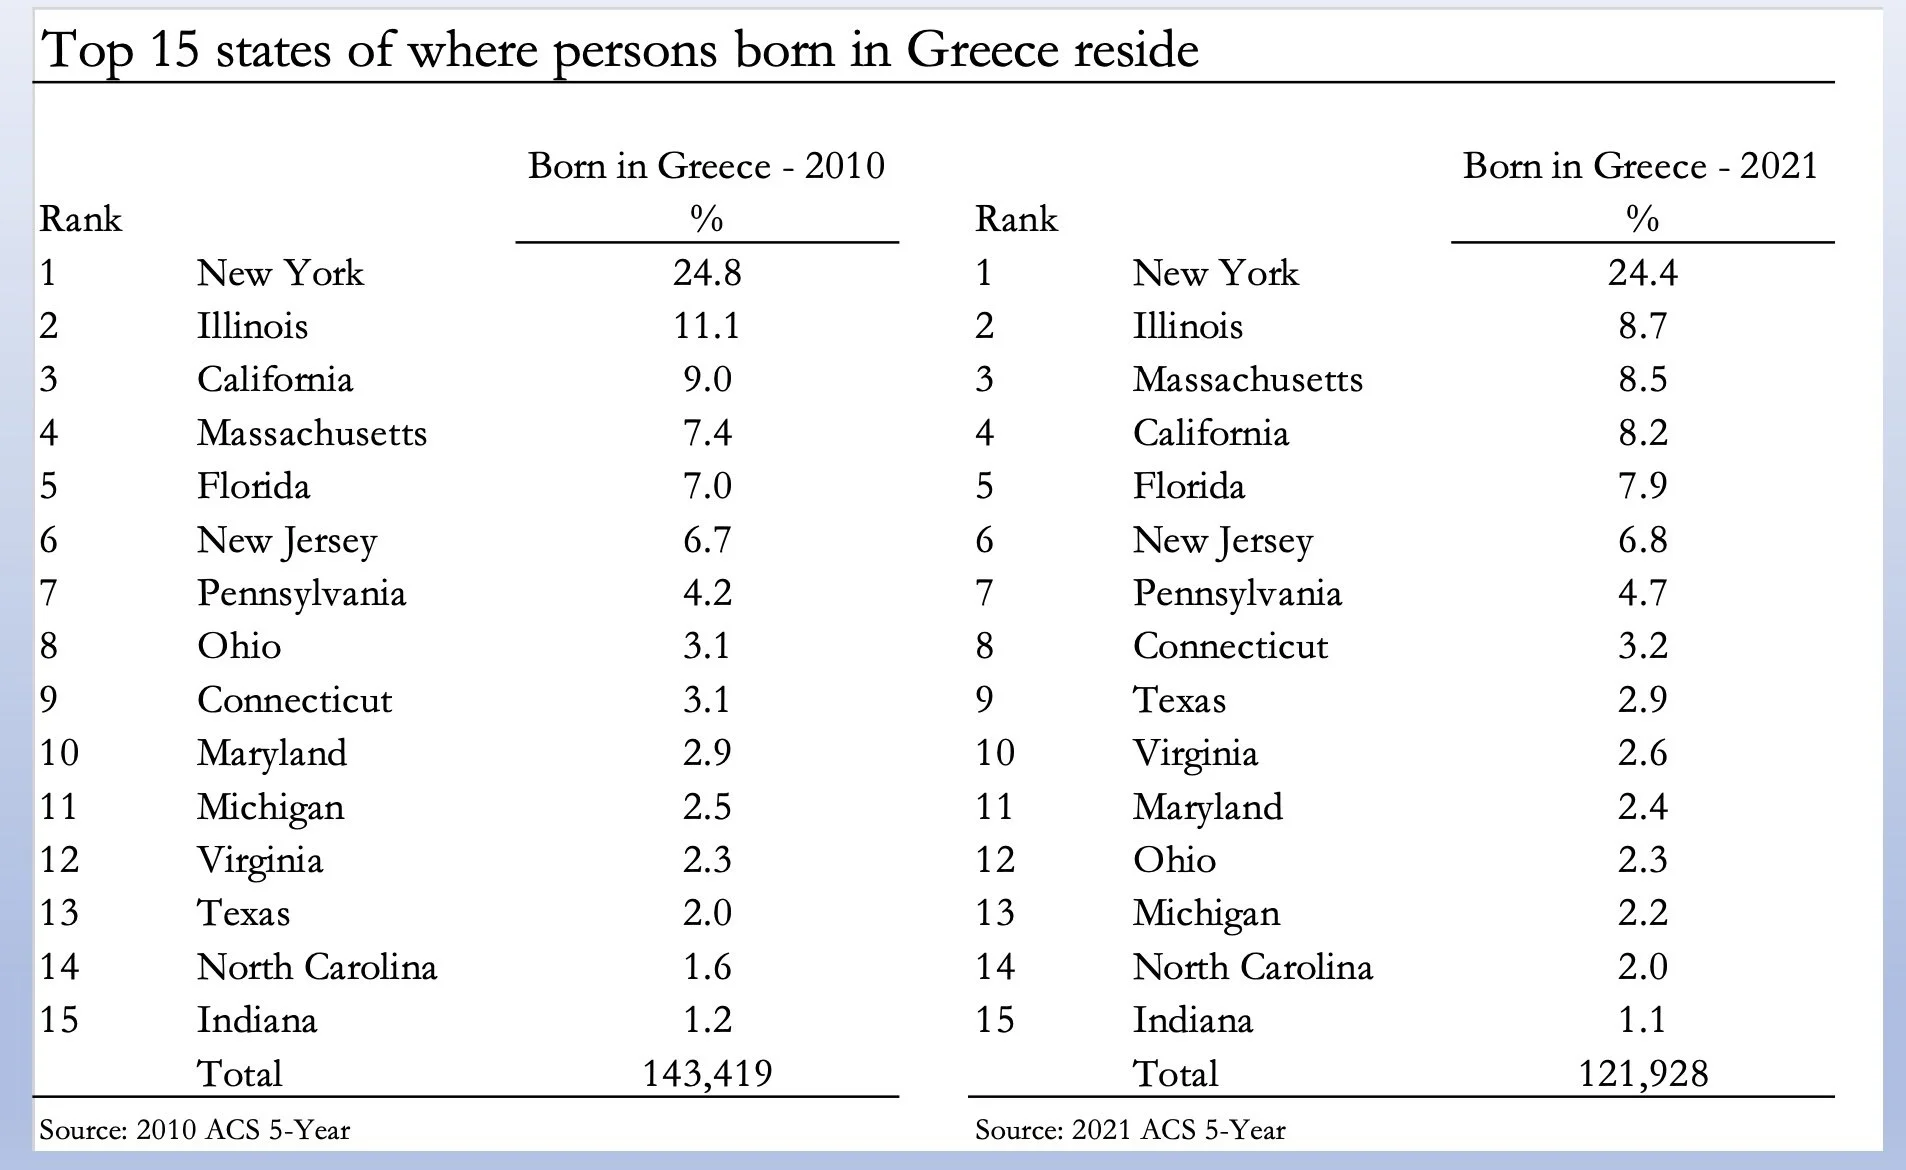
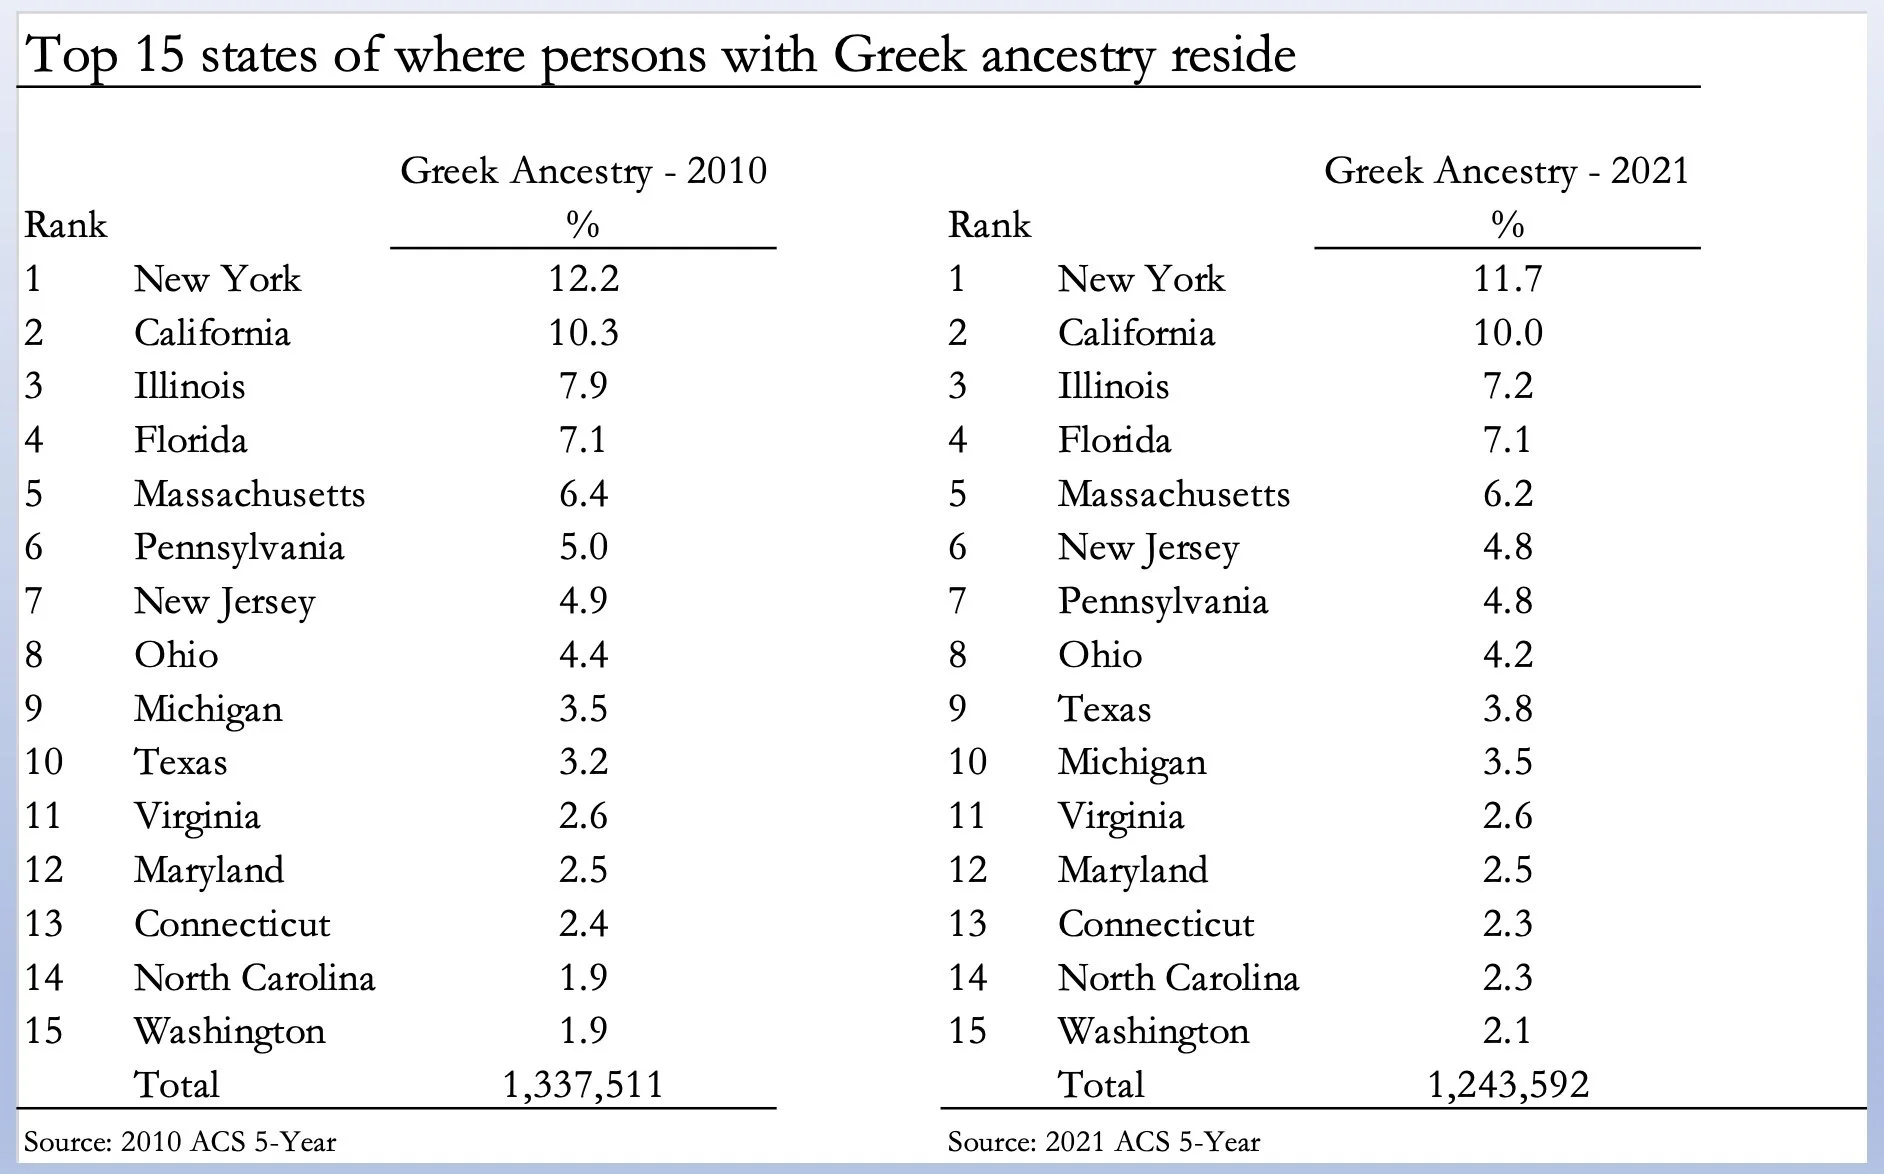
Tables showing the top 15 states of persons born in Greece and those reporting Greek ancestry resided in the U.S. using data from the 2021 5-Year American Community Survey (ACS).
With the release of the 2021 American Community Survey (ACS) data, I will be posting a series of tables that descriptively explore various sociodemographic and economic characteristics of Greek Americans in the U.S.
For this post, I present data related to “place of birth” and “ancestry” from the 2021 5-year sample estimates. For comparative purposes, I have also added data from the 2010 5-year estimates.
A key finding from the first table (below), which shows the top 15 states where persons born in Greece resided in 2021 and 2010, is that persons born in Greece are heavily concentrated in a few states across the U.S. The table also reveals the following patterns:
The top 15 states account for 88% of all persons born in Greece in 2021. This represents a slight decrease from 2010 when the share was nearly 89%.
New York State accounts for 24% and 25% of all persons born in Greece in 2021 and 2010, respectively.
After NY state, Illinois, Massachusetts, and California account for another 25% of persons born in Greece in 2021. The share for the above three states in 2010 was 27%.
The second table (below) shows the top 15 states where persons reporting Greek ancestry resided in 2021 and 2010. A couple of key points from the table are:
The top 15 states account for 75% and 76% of all persons born in Greece in 2021 and 2010.
New York and California make up the largest share of all states where persons of Greek ancestry reside. For example, just over 20% of persons reporting Greek ancestry resided in NY and CA.
Feel free to share your thoughts here or at grigoris.argeros@gmail.com.
Data Explorations of the Greek American Community
Feel free to visit the Facebook page “Data Explorations of the Greek American Community” for more tables, figures, and maps on Greek Americans. There is also an Instagram profile at https://www.instagram.com/greek_americans/) and a Twitter one at https://twitter.com/greeksintheus. The Facebook page, however, has the most up-to-date information and results.
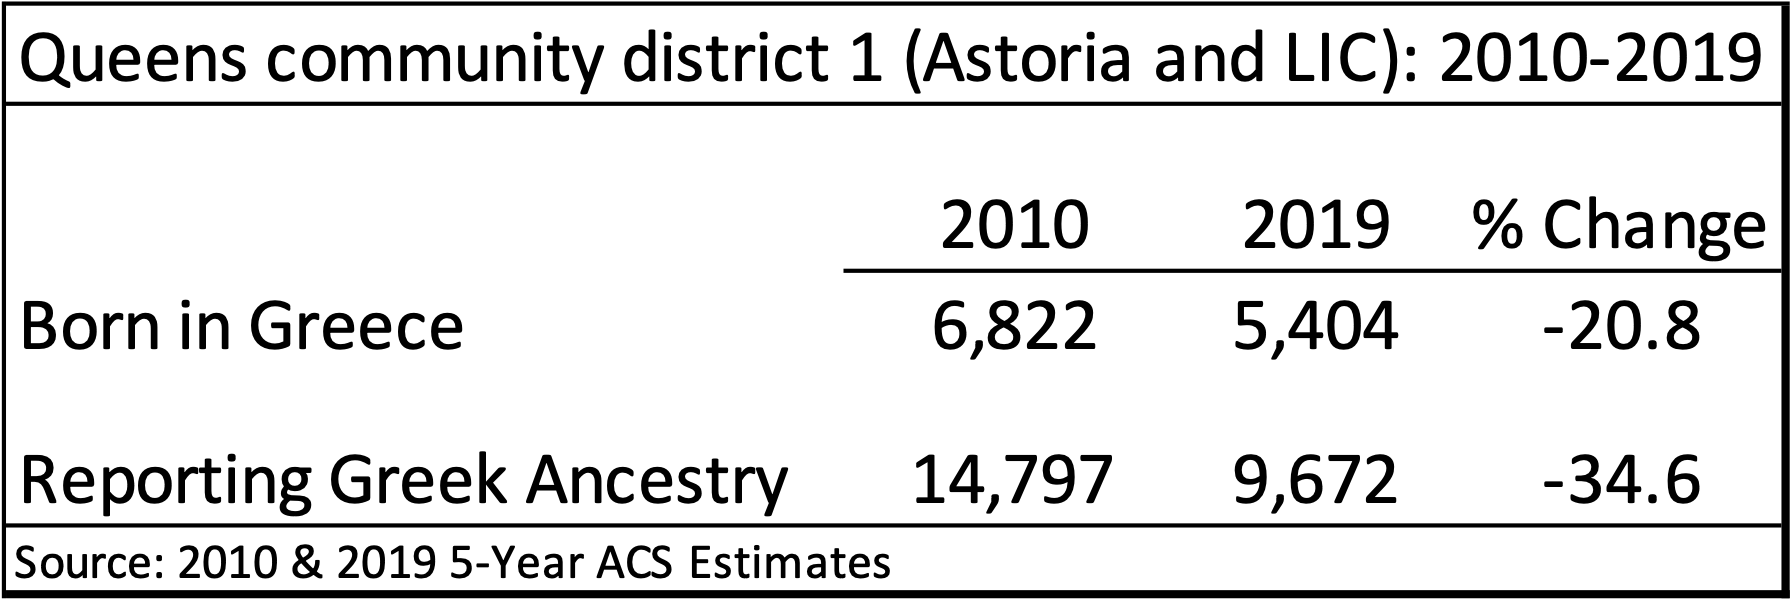
Greeks in Astoria and LIC (Queens Community District #1), 2010-2019
Share of those born in Greece and those reporting Greek ancestry has declined in Astoria and Long Island City between 2010 and 2019.

Greeks in Westchester County, NY
Maps showing 1) persons born in Greece and 2) persons reporting Greek ancestry in Westchester County, NY. Three quarters of those born in Greece are located in Eastchester, Greenburgh, Harrison, Lewisboro, New Castle, New Rochelle, Ossining, Pound Ridge, Scarsdale, Yonkers, & Yorktown.

