Where Greek Americans Live in the U.S.: State and County Patterns
This post provides a brief statistical snapshot of where Greek Americans live in the United States based on the 2023 American Community Survey (ACS) 5-year estimates, the most recent available data. When the 2024 ACS 5-year estimates are released later this month (January 2026), I will follow up with a more detailed analysis of the socioeconomic and demographic characteristics of Greek Americans. Throughout this post, Greek Americans are defined using the ancestry question.
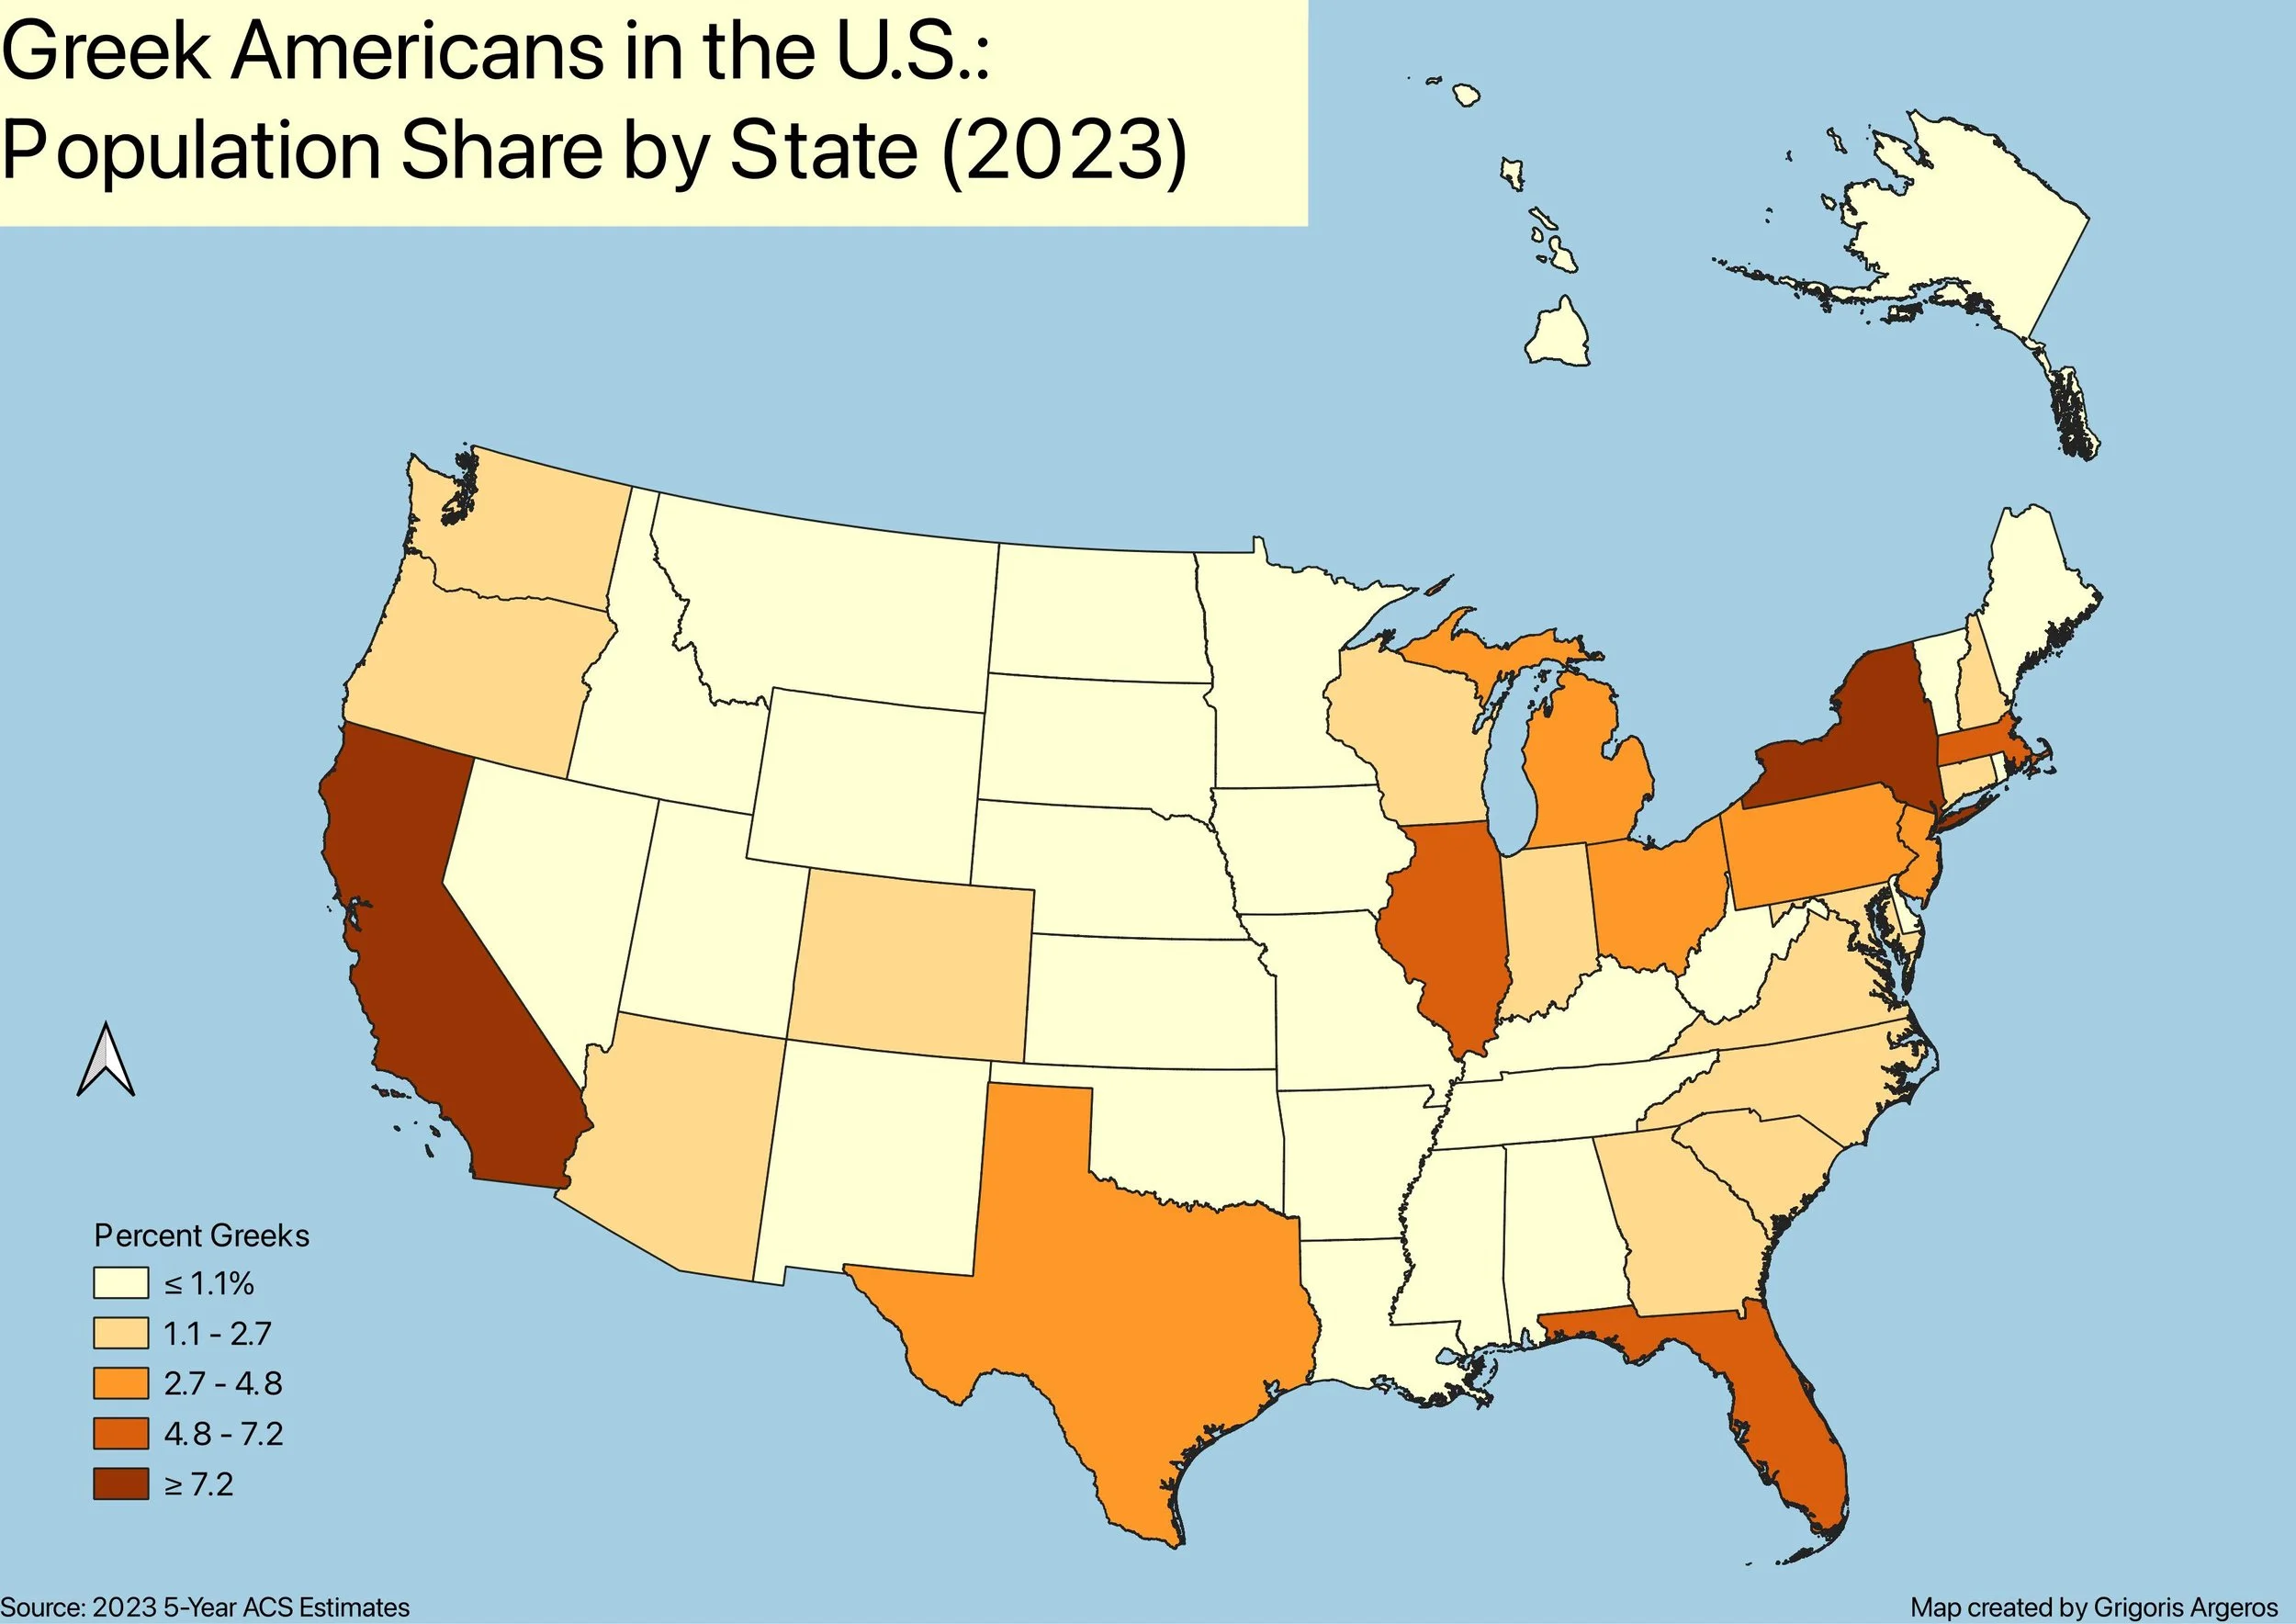
Greek Americans in the United States: Population Share by State (2023 ACS)
This map (Figure 1) shows each state’s share of the total U.S. Greek-American population. The map reveals a strong concentration of Greek Americans in a relatively small number of states, particularly New York, California, Florida, Illinois, Massachusetts, and Texas, while much of the remaining country accounts for relatively small shares.
Map 1
Top 25 States by Greek-Ancestry Population (2023 ACS)
Complementing the map, Table 1 (below) lists the top 25 states by Greek American population, along with each state’s share of the total U.S. Greek population and the cumulative percentage accounted for by these states. The top 25 states account for approximately 90% of the U.S. Greek American population.
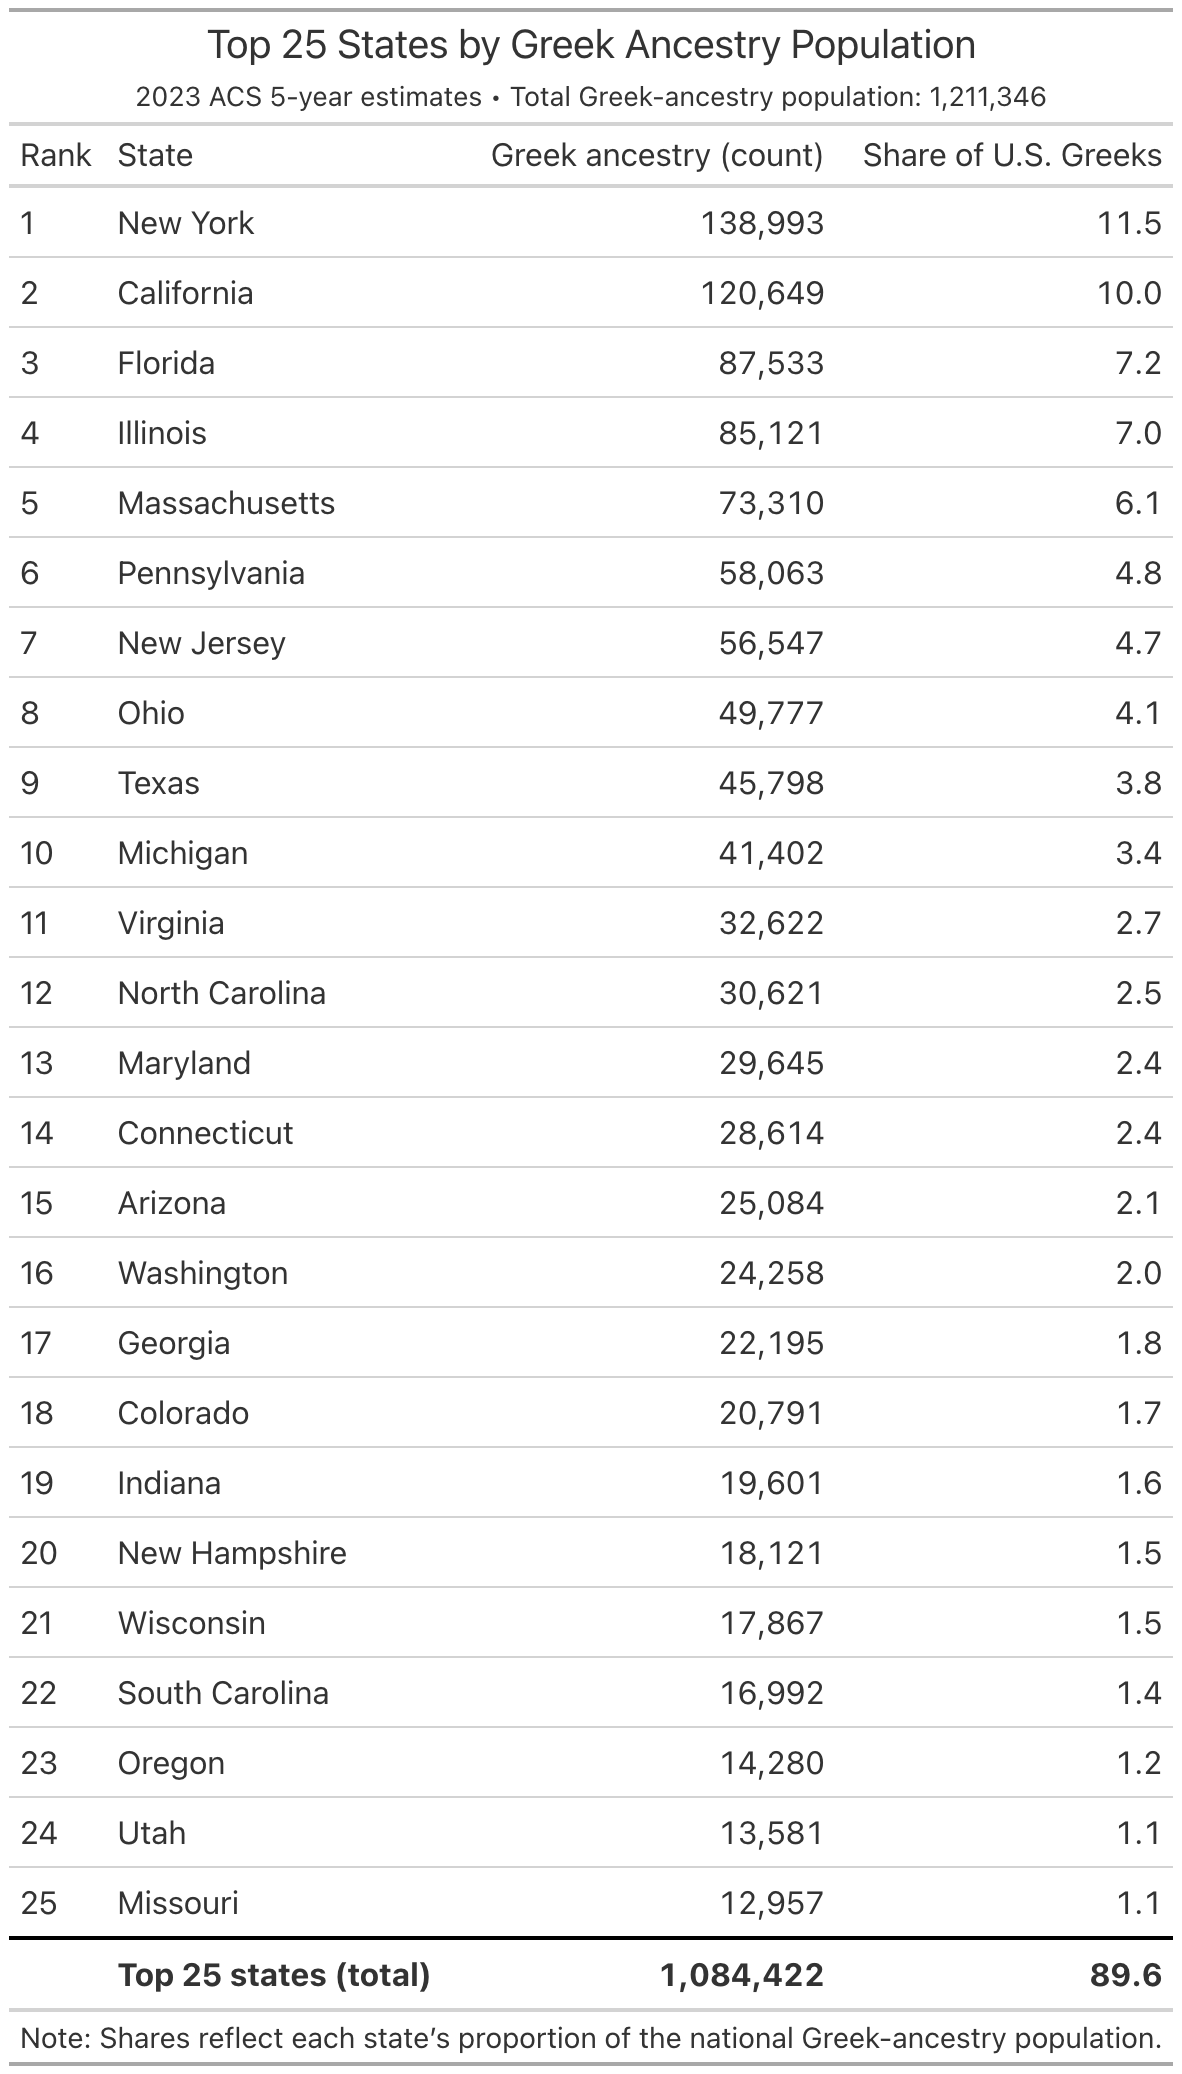
Table 1
While state-level patterns highlight broad regional concentration, county-level data reveal a much more uneven distribution, with Greek Americans clustered in a relatively small number of counties, especially within large metropolitan areas.
Counties Account for Approximately One-Third of the U.S. Greek-Ancestry Population
Table 2 (below) shows that Greek Americans are geographically concentrated in a relatively small number of counties, while the majority are dispersed across other counties nationwide. Roughly one-third (33%) of the U.S. Greek-ancestry population resides in the 33 counties listed in the table. The remaining two-thirds are spread across other counties, underscoring both the presence of major local concentration areas and the broader geographic dispersion of Greek Americans across the U.S.
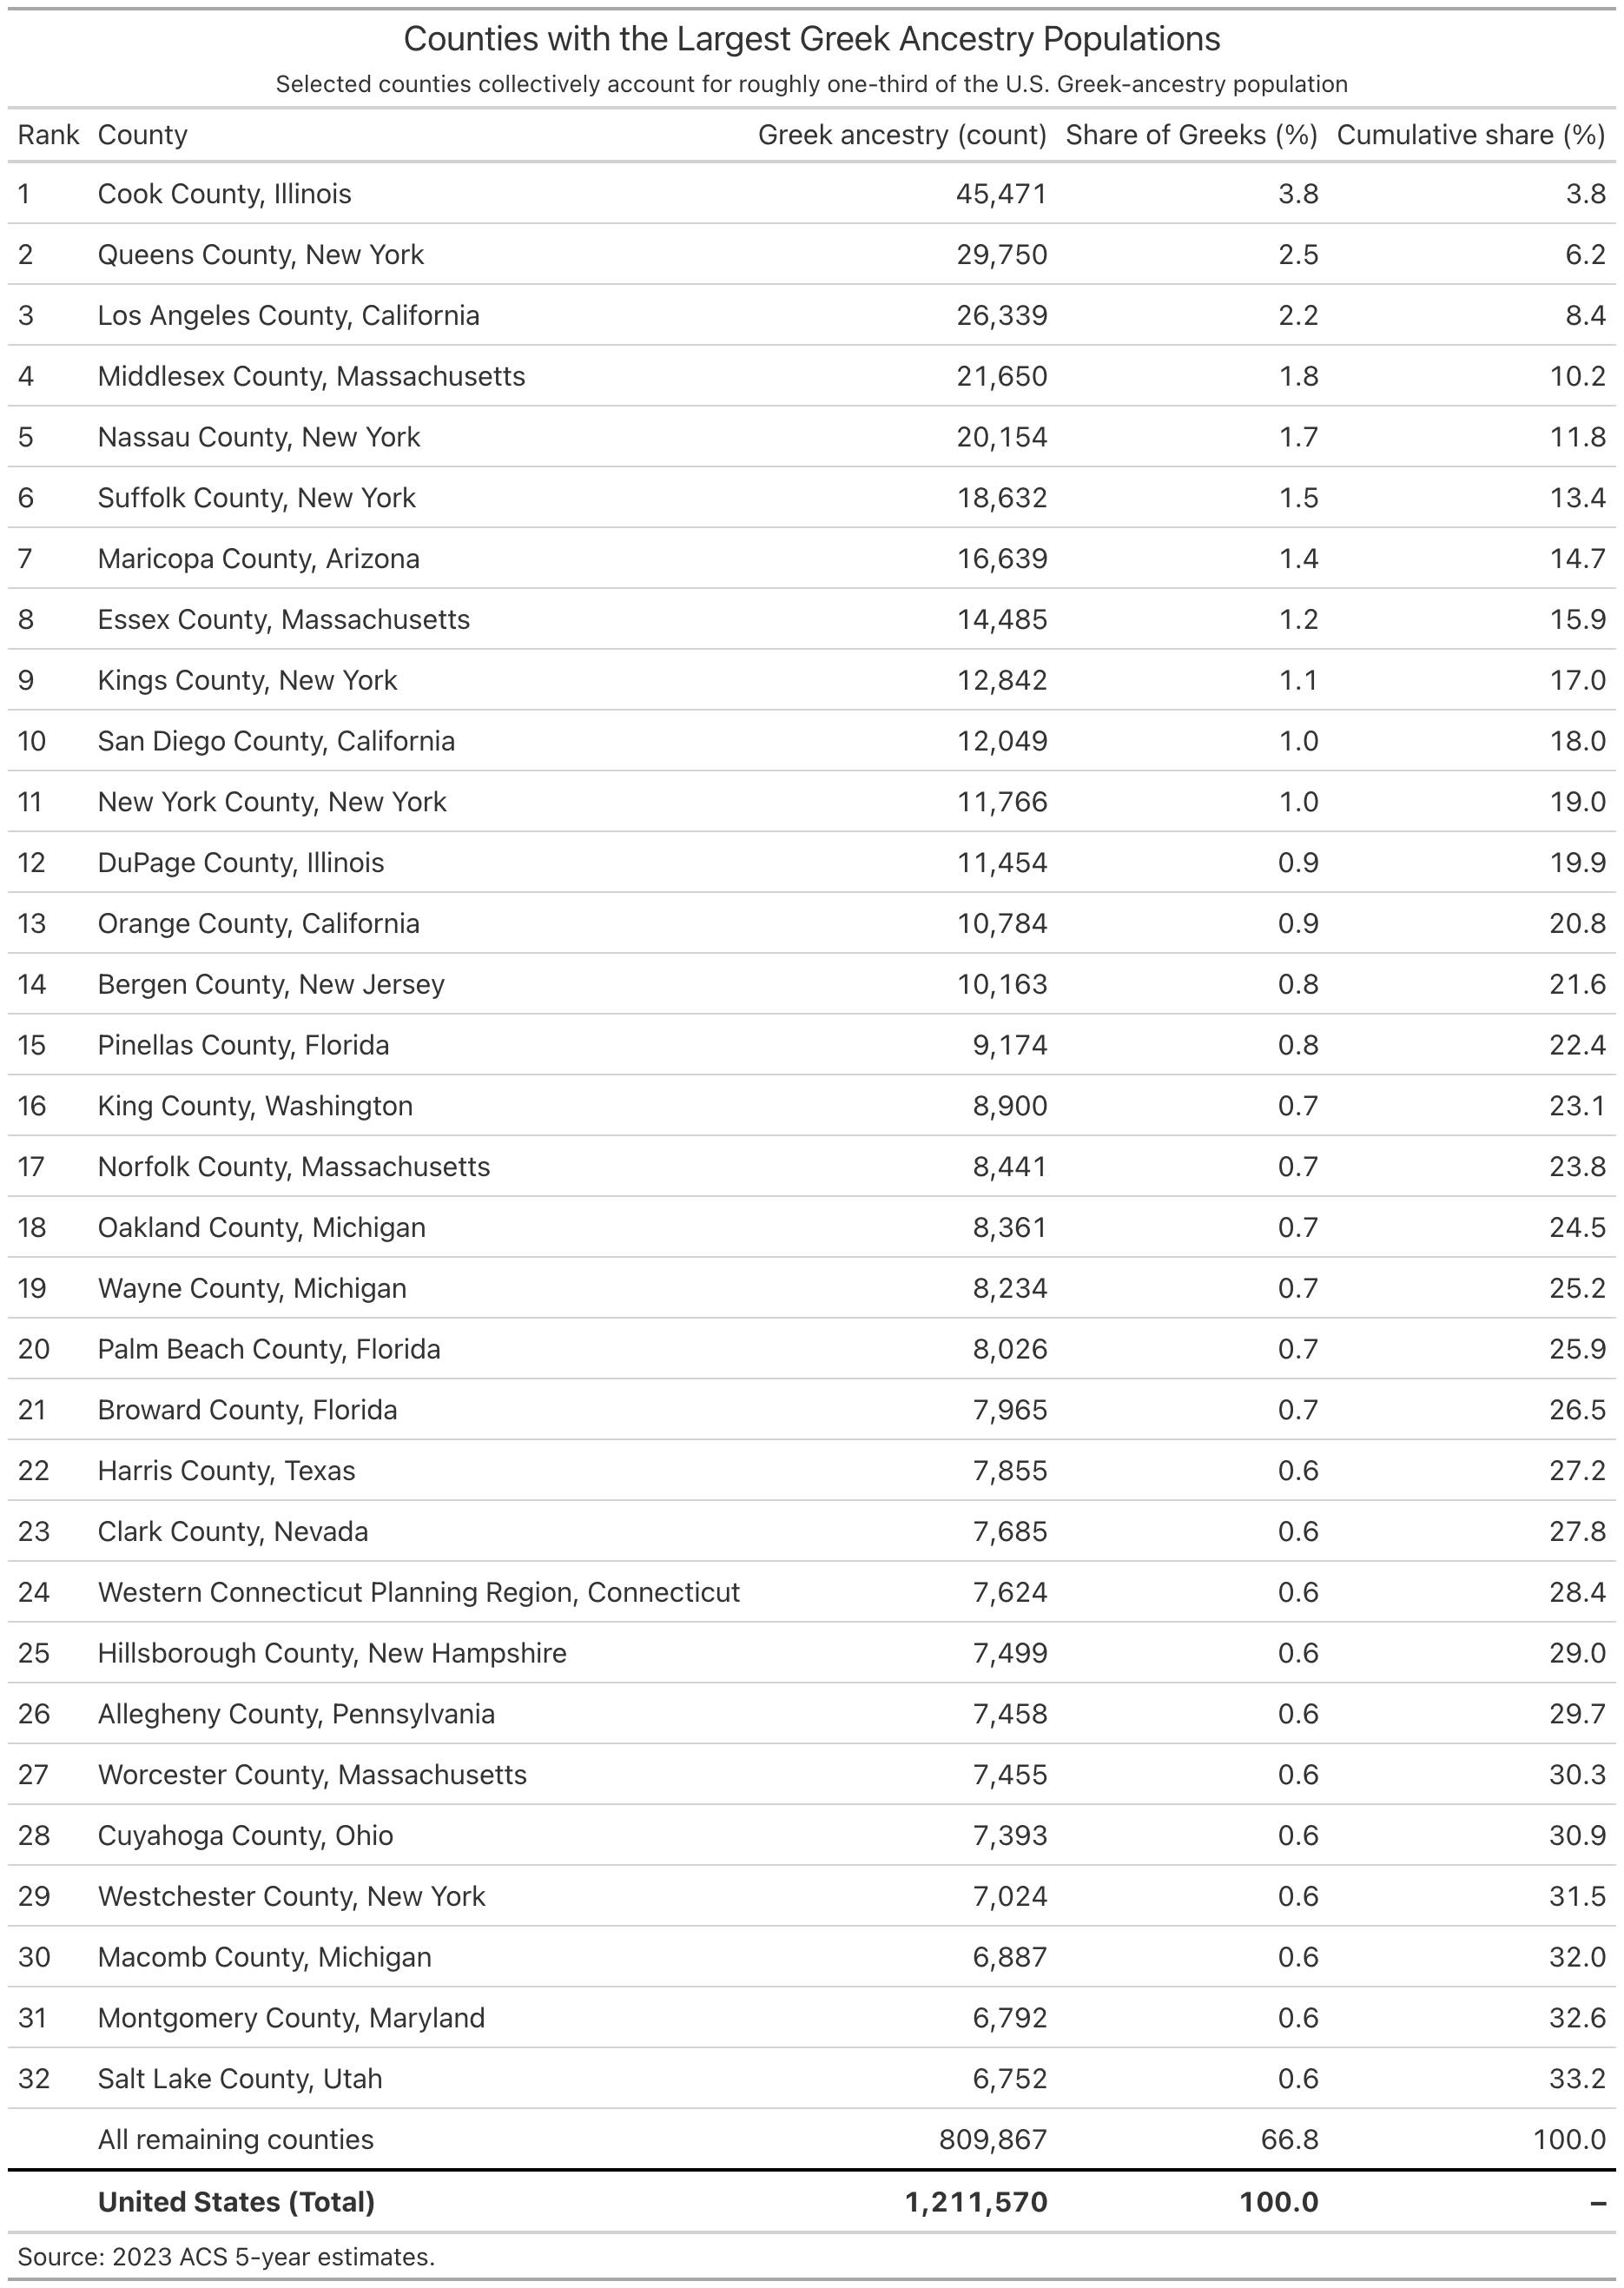
Table 2
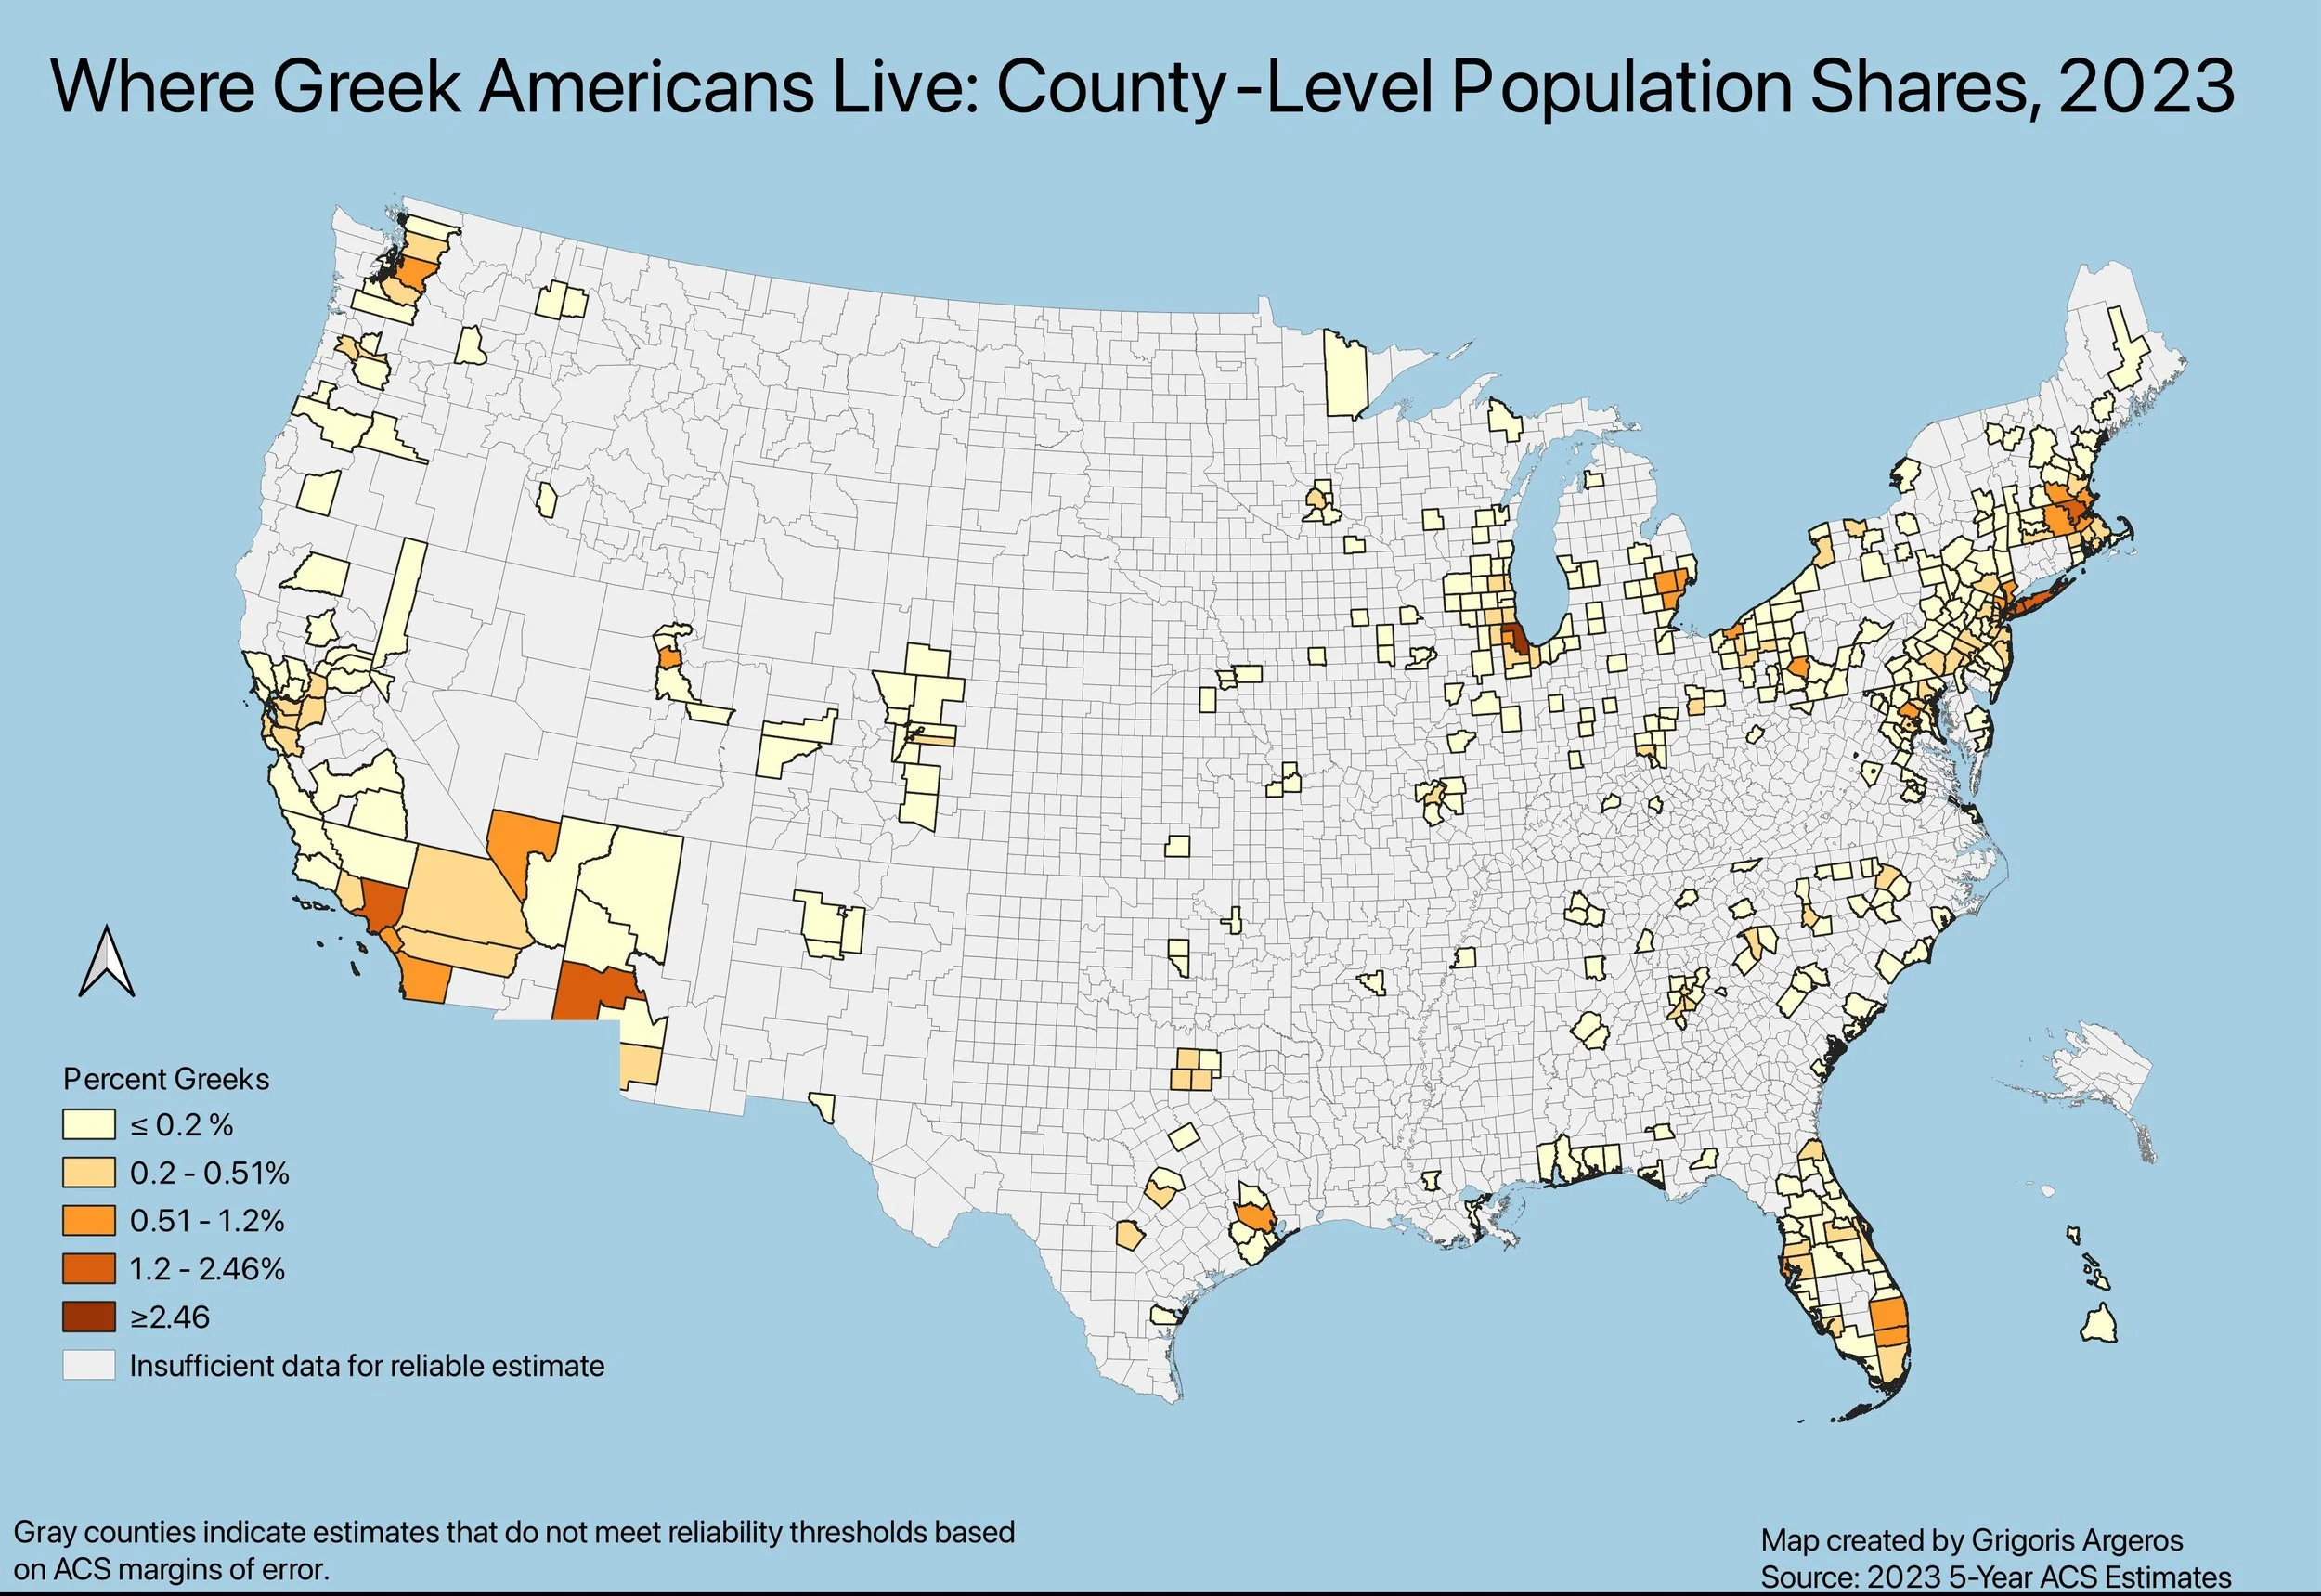
Where Greek Americans Live: County Level Population Shares, 2023
We now turn to the county-level map (Figure 2 below), which shows each county’s share of the total U.S. Greek American population. Please note that to address sampling variability in small-area ACS estimates, counties that do not meet reliability thresholds based on margins of error are shaded in gray. These gray areas should not be interpreted as having no Greek population; rather, they indicate insufficient statistical precision for reliable mapping. Overall, the map highlights strong clustering in and around major metropolitan areas, including the Northeast, Midwest, Southern California, and parts of Florida, as well as select Sun Belt metros such as Las Vegas.
Map 2