Greek Americans in the United States: A Brief Statistical Snapshot
Evidence from the 2024 American Community Survey (1-Year Estimates)
This post provides a brief descriptive snapshot of Greek Americans using data from the 2024 American Community Survey (ACS) 1-year estimates. The goal is to document what the data show about the basic sociodemographic composition and housing patterns of the Greek-American population in the United States. The ancestry question is used to define Greek-Americans. This post does not attempt to provide a definitive definition of Greek-American identity or to explain why these patterns exist.
Figure 1 presents a population pyramid illustrating the age- and sex-based distribution of Greek Americans.
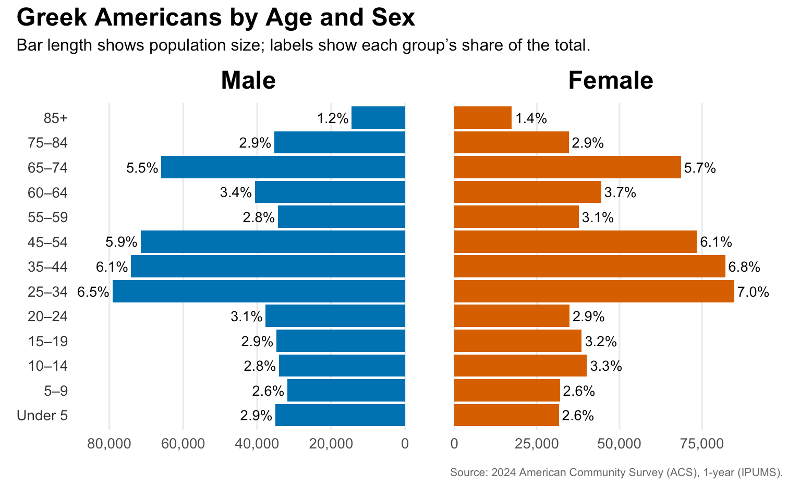
Figure 1
Overall, Figure 1 shows a community centered around middle and older adulthood, with fewer children and a modest female advantage at older ages.
We see that the largest shares are concentrated in the middle adult years, especially ages 25–34, 35–44, and 45–54. These working-age groups constitute a substantial portion of both men and women. Children and teenagers account for a smaller share of the population. Each age group under 20 accounts for only a few percent of the total, indicating that Greek Americans skew older than the overall population. At older ages, women slightly outnumber men. This is most noticeable after age 65, when women constitute a somewhat larger share in the 65-74 and 85+ age groups.
Table 1 provides a concise overview of the basic size, sex composition, and age structure of the Greek-American population. Overall, there are just over 1.2 million people in the US who report Greek ancestry. The population is slightly more female than male, with women making up a small majority and a sex ratio of 95 males per 100 females. In terms of age, the median is 40 years. Individuals under age 18 account for approximately one-fifth of the population, while adults aged 65 and older constitute nearly the same share.
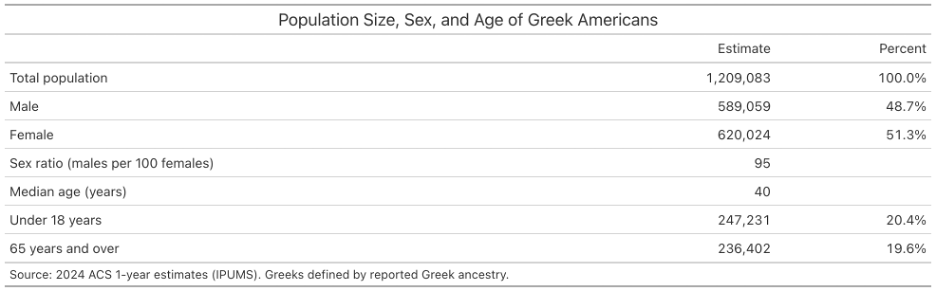
Table 1
Table 2 presents the Hispanic origin and racial composition of Greek Americans. The overwhelming majority (about 96%) reports being non-Hispanic and White. Smaller shares identify as Hispanic (5%) or as belonging to two or more races (4%).
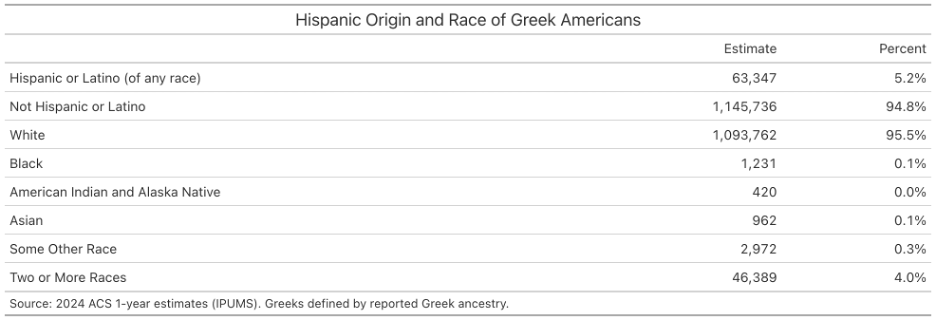
Table 2
Table 3 summarizes employment status and occupational distribution among Greek Americans ages 16 and over. Approximately two-thirds (65.9%) are in the labor force, while just over one-third (34.1%) are not. The bottom panel looks at the occupational distribution of the civilian employed population aged 16 and over. Within this employed group, the largest category is “Managerial and Professional” (50.2%), followed by “Technical, Sales, and Administrative” (25.0%) and “Service” (13%) occupations.
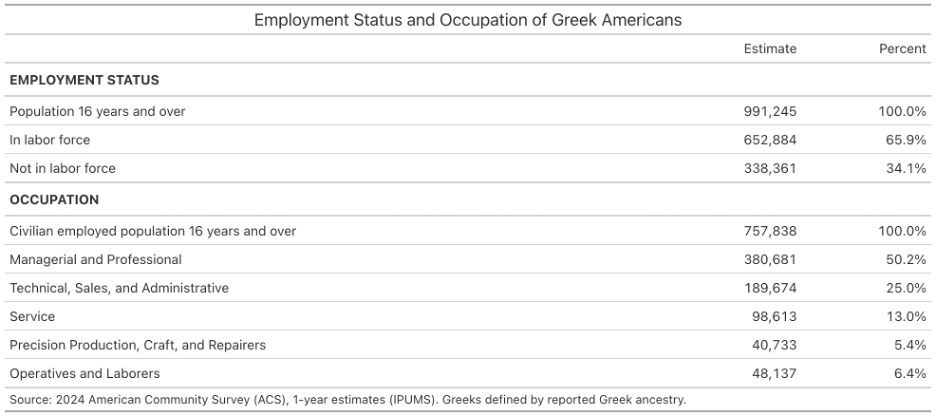
Table 3
Table 4 summarizes the class of worker among Greek Americans ages 16 and over who reported working at some point within the past five years. Most Greek Americans are wage or salary workers, accounting for nearly 88% of the employed population. Within this group, the largest share works in the private sector (63%), followed by employment in non-profit organizations (9%) and local government employment (8.3%).
Self-employment accounts for 12% of employed Greek Americans. This group is divided almost evenly between those who are self-employed but not incorporated, such as individual business owners, and those who are self-employed and incorporated. Only a very small share of Greek Americans is classified as unpaid family workers, representing a negligible portion of the employed population.
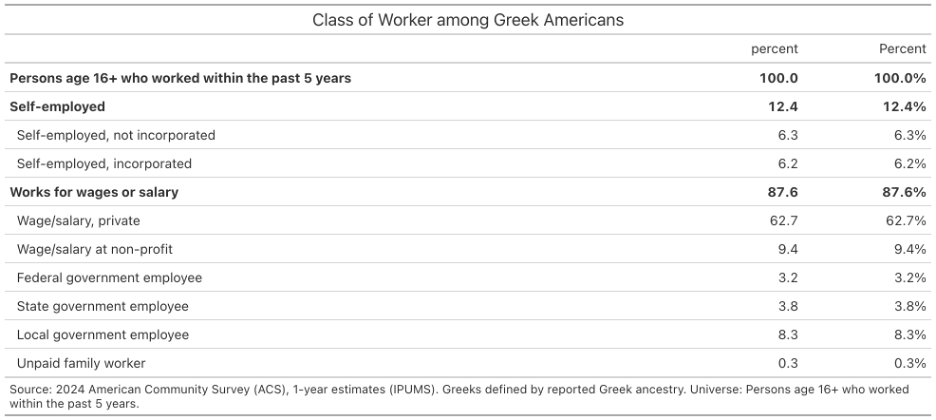
Table 4
Table 5 shows the industries where Greek Americans worked. No single industry dominates employment. Greek Americans are spread across many professional, business, retail, and service industries. Altogether, the top 25 industries account for about two-thirds of jobs, with the remaining workers distributed across a wide range of other industries. The largest shares are in eating and drinking places, elementary and secondary schools, and construction, each accounting for approximately 5-8 percent of workers. Health- and education-related industries, including hospitals, colleges, and health services, also employ a sizable share.
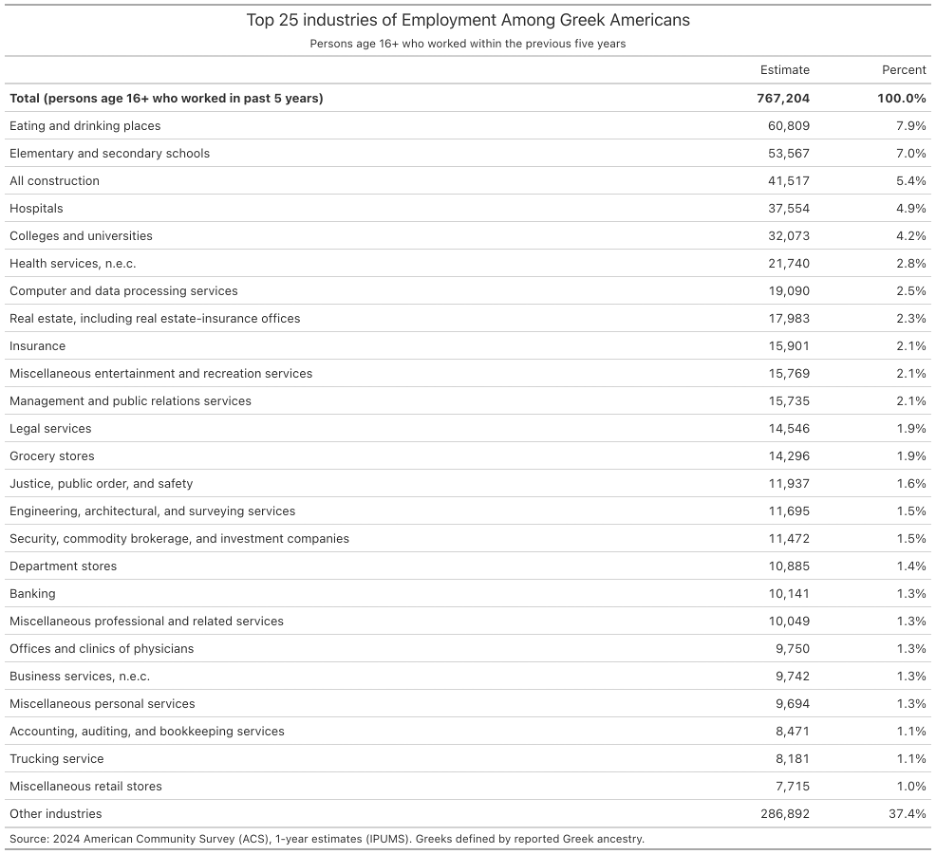
Table 5
Table 6 shows who people are within Greek-American households. Most household members are householders, spouses, or children, who together account for approximately 90% of the total. Children make up just over one-quarter of all household residents, while spouses account for about one-fifth. Smaller shares consist of parents, siblings, grandchildren, and other relatives. Non-relatives, such as partners, friends, or visitors, constitute a relatively small share of residents in Greek-American households.

Table 6
Table 7 describes household composition and multigenerational living among Greek Americans. The majority of households are family households, with married-couple families accounting for approximately 70%. Female-headed households without a husband (about 10%) and male-headed households without a wife (about 3%) make up a smaller share. Nonfamily households constitute a smaller share, including individuals living alone (about 8% female and 7% male) and smaller shares living with others.
The average household size is 3.01 persons.
The multigenerational section shows that two-generation households are the most common, representing just over half (53%) of households, while one-generation households account for about 42%. The three or more generations category makes up a smaller share, around 5%.
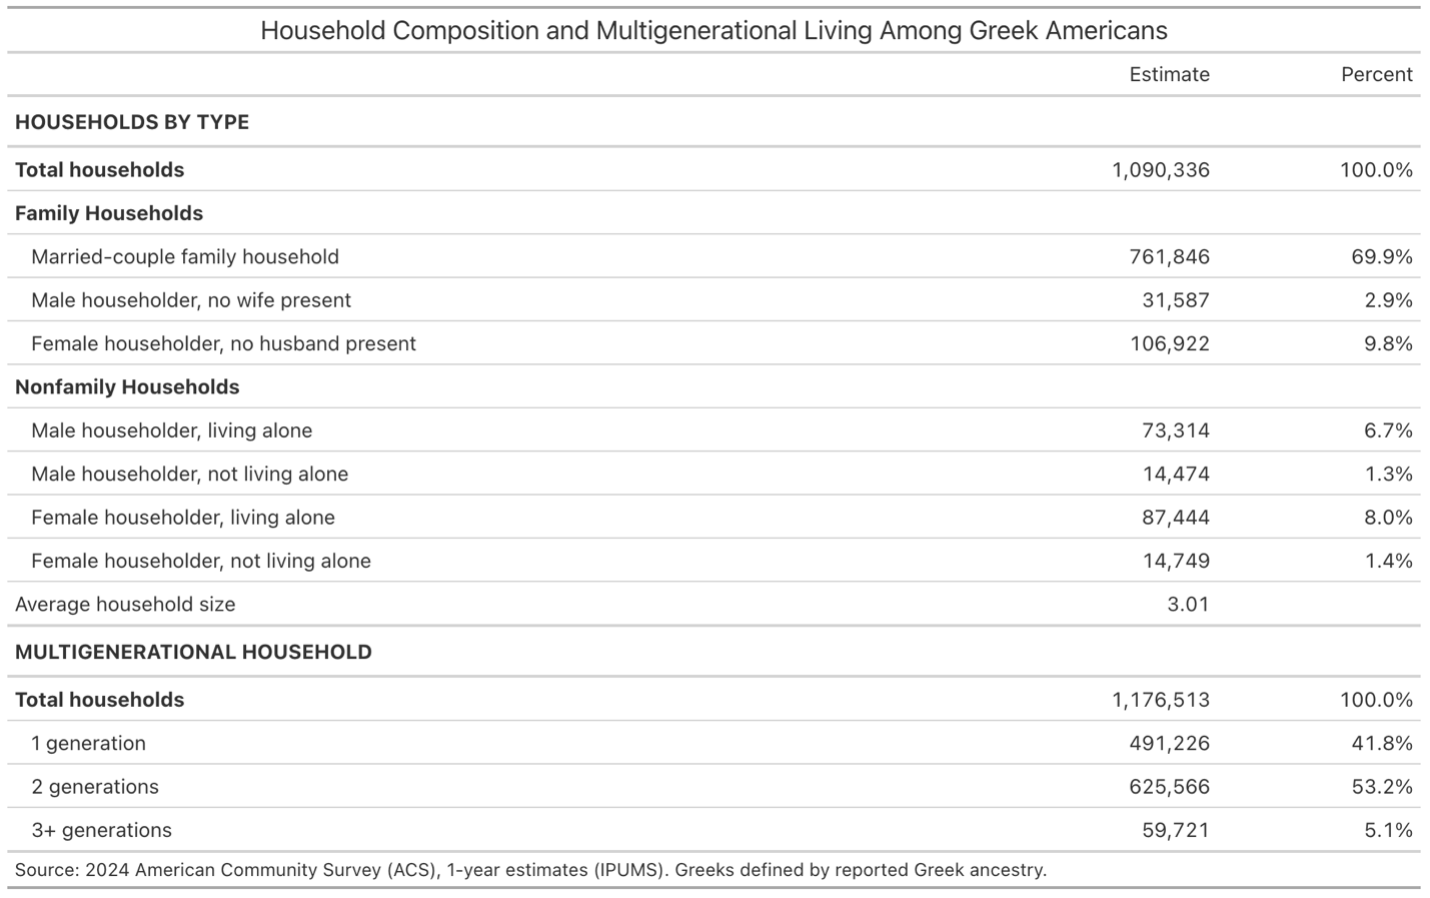
Table 7
Table 8 looks at marital status. Overall, the table shows that marriage and singlehood account for the vast majority of the sample. The population is almost evenly split between those who are married with a spouse present (42.1%) and those who have never married or are currently single (43.9%). Smaller shares fall into the other categories: about 8% are divorced, just over 4% are widowed, and less than 2% combined are separated or married with a spouse absent.
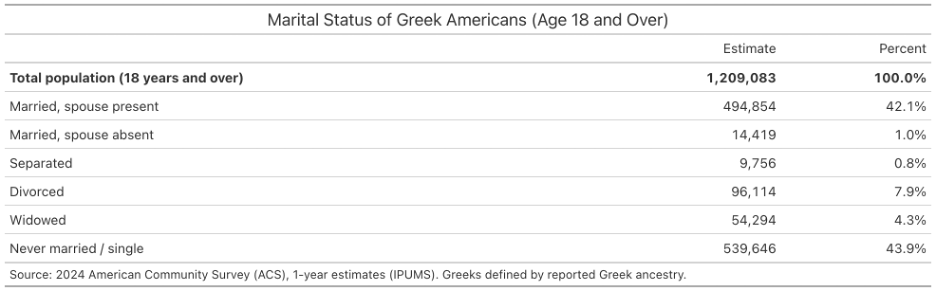
Table 8
Table 9 describes the relationship between Greek Americans living in households and the household head. Overall, the table shows that Greek-American households are primarily composed of nuclear family members, with a relatively limited presence of extended kin and non-relatives. Most people fall within immediate family member roles. Householders account for nearly 43% of household residents, children for 27.7%, and spouses for 19.3%. Together, these three categories represent almost nine in ten household residents.
Smaller shares include extended family members such as grandchildren (1.3%), other relatives (0.6%), siblings (0.5%), and various in-laws, each accounting for well under 1% individually. Non-relatives constitute a modest share of household residents, with partners, friends, or visitors accounting for 4% and other non-relatives for about 3%.
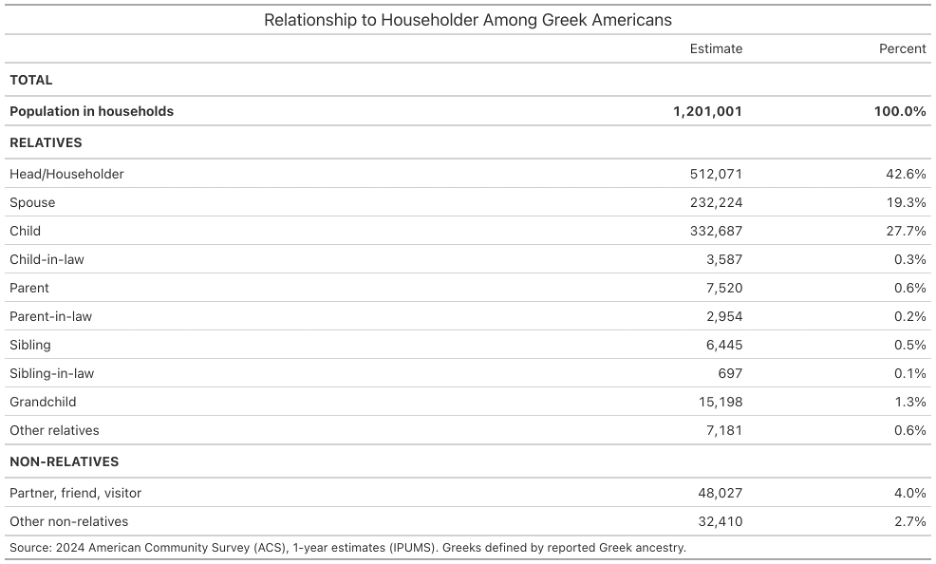
Table 9
Table 10 presents an overview of school participation and educational attainment among Greek Americans, including attendance, enrollment patterns, school type, and educational attainment. About one-quarter (24.3%) are currently enrolled in school, while roughly three-quarters (75.7%) are not. Of those enrolled, 22% are college undergraduates, followed by upper elementary grades (20.8%), elementary grades 1–4 (19.1%), and high school students (19.1%). Smaller shares are enrolled in nursery or preschool (7.5%), graduate or professional programs (7.2%), and kindergarten (4.2%).
Most enrolled Greek-American students attend public schools (73.9%), while 26.1% attend private schools.
Regarding educational attainment, approximately 25% have less than a high school education, and 15.2% hold a high school diploma. Postsecondary education is common: 22.7% hold a bachelor’s degree, 10.9% hold a master’s degree, 3.1% hold a professional degree, and 2.5% have a doctoral degree. Lastly, approximately 15% report some college but no degree or associate’s degree (6.1%).
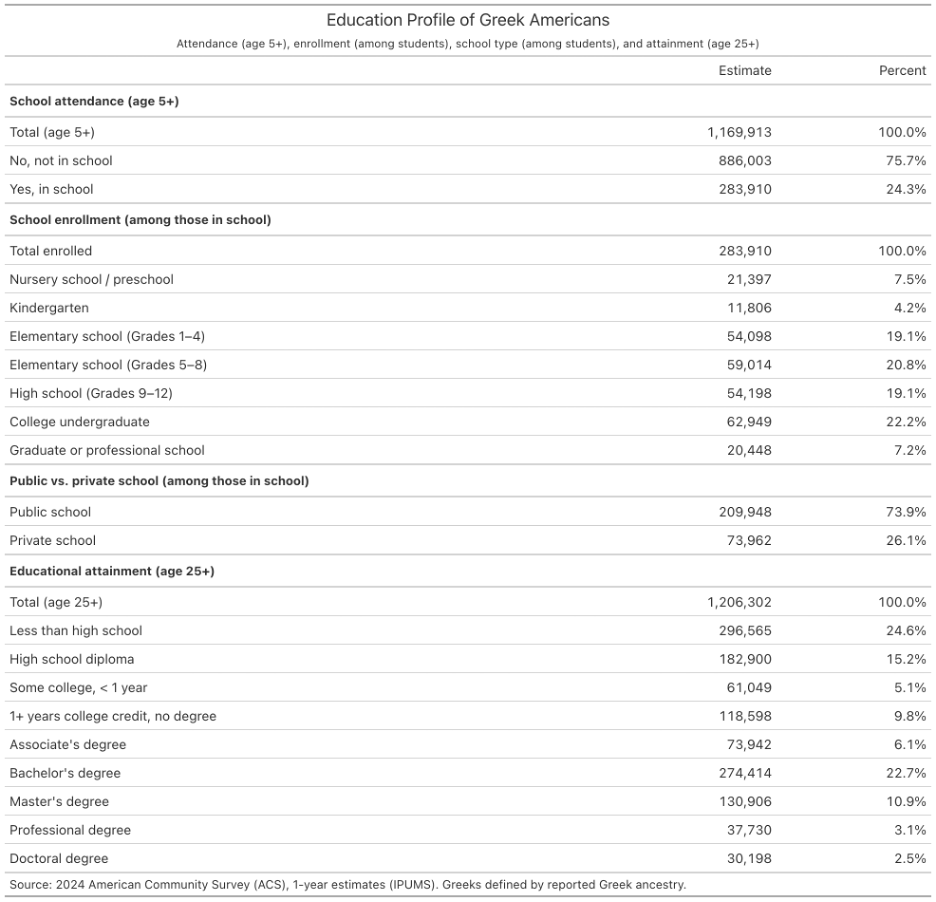
Table 10
Table 11 presents information on birthplace, migration history, language use, housing tenure, residential stability, and veteran status among Greek Americans.
Birthplace
Most Greek Americans are native-born (88.0%), while about 12% are foreign-born. Among the latter group, nearly 9% were born in Greece, and 3% were born elsewhere outside the U.S.
Year of Entry
Among those born outside the U.S., migration spans several decades. Recent arrivals make up a small share: about 1% arrived in the U.S. between 2019 and 2024, and 1% between 2014 and 2018. Nearly 9% entered before 2004.
World Region of Birth (Foreign-Born)
Among foreign-born Greek Americans, the majority (74%) were born in Greece. Canada is the second most common country of birth (3.5%), followed by smaller shares born in Asia, Germany, Africa, South America, Australia and New Zealand, Turkey, Eastern Europe, and other regions.
Language Spoken at Home
English is the primary language spoken at home for about 78% of Greek Americans. 19% speak Greek, making it the second most common language. Smaller shares speak Spanish, French, Arabic, and other languages, each accounting for 1–2% or less.
Homeownership
Housing tenure shows that over three-quarters of Greek-Americans are homeowners. About 24% own their homes outright, while just over half (53%) own with a mortgage or loan. Approximately 22% of renters pay rent in cash, and a very small share live in housing without cash rent.
Year Householder Moved Into Unit
Residential tenure varies widely, reflecting a mix of recent movers and long-term residents. About 21% of householders moved into their homes since 2020; others report longer tenures: 18% moved between 2015 and 2019, 17% between 2005 and 2014, and just over 13% moved before 1995.
Veteran Status
The vast majority of Greek Americans report no military service (94%). Approximately 5% are veterans, while very small shares are currently on active duty (0.5%) or in training for the Reserve or National Guard (0.9%).
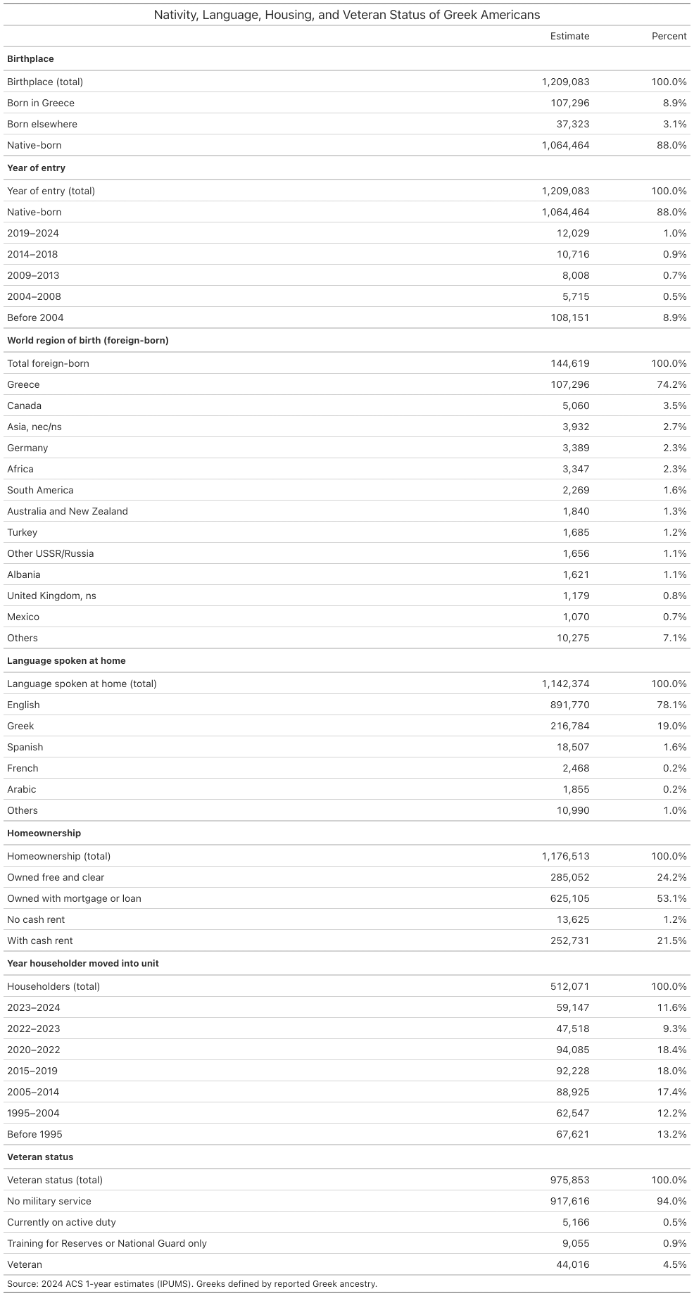
Table 12
Thank you for reading, and as always, feel free to leave a comment or contact me at grigoris.argeros@gmail.com.