Greek Immigrant Socioeconomic Position in the Early 20th Century: A Brief Data Snapshot
This post analyzes Greek immigrant literacy, occupational standing, and a combined educational index using U.S. Census microdata. The post begins by looking at Greek immigrant literacy from 1900 to 1930, then uses 1930 Census data to explore occupational standing, a combined educational index, and differences by year of arrival. The findings show that Greeks started with low literacy rates but improved quickly, often held medium-skill occupations, and differed in outcomes depending on when they immigrated to the U.S. I also compare Greek immigrants from the 1890 - 1924 “first great wave”, as identified by Charles Moskos, with those who immigrated in other years before 1930.
1. Literacy: A Rapid Climb Upward
Greek immigrant literacy rates, measuring the ability to read and/or write in any language, grew from 71% in 1900 to 89% in 1930, representing a nearly 25% increase. By 1930, Greek immigrants caught up with other immigrant groups, whose literacy rates slightly increased 87% to 90% (approximately a 4% gain). (see Figure 1 below)

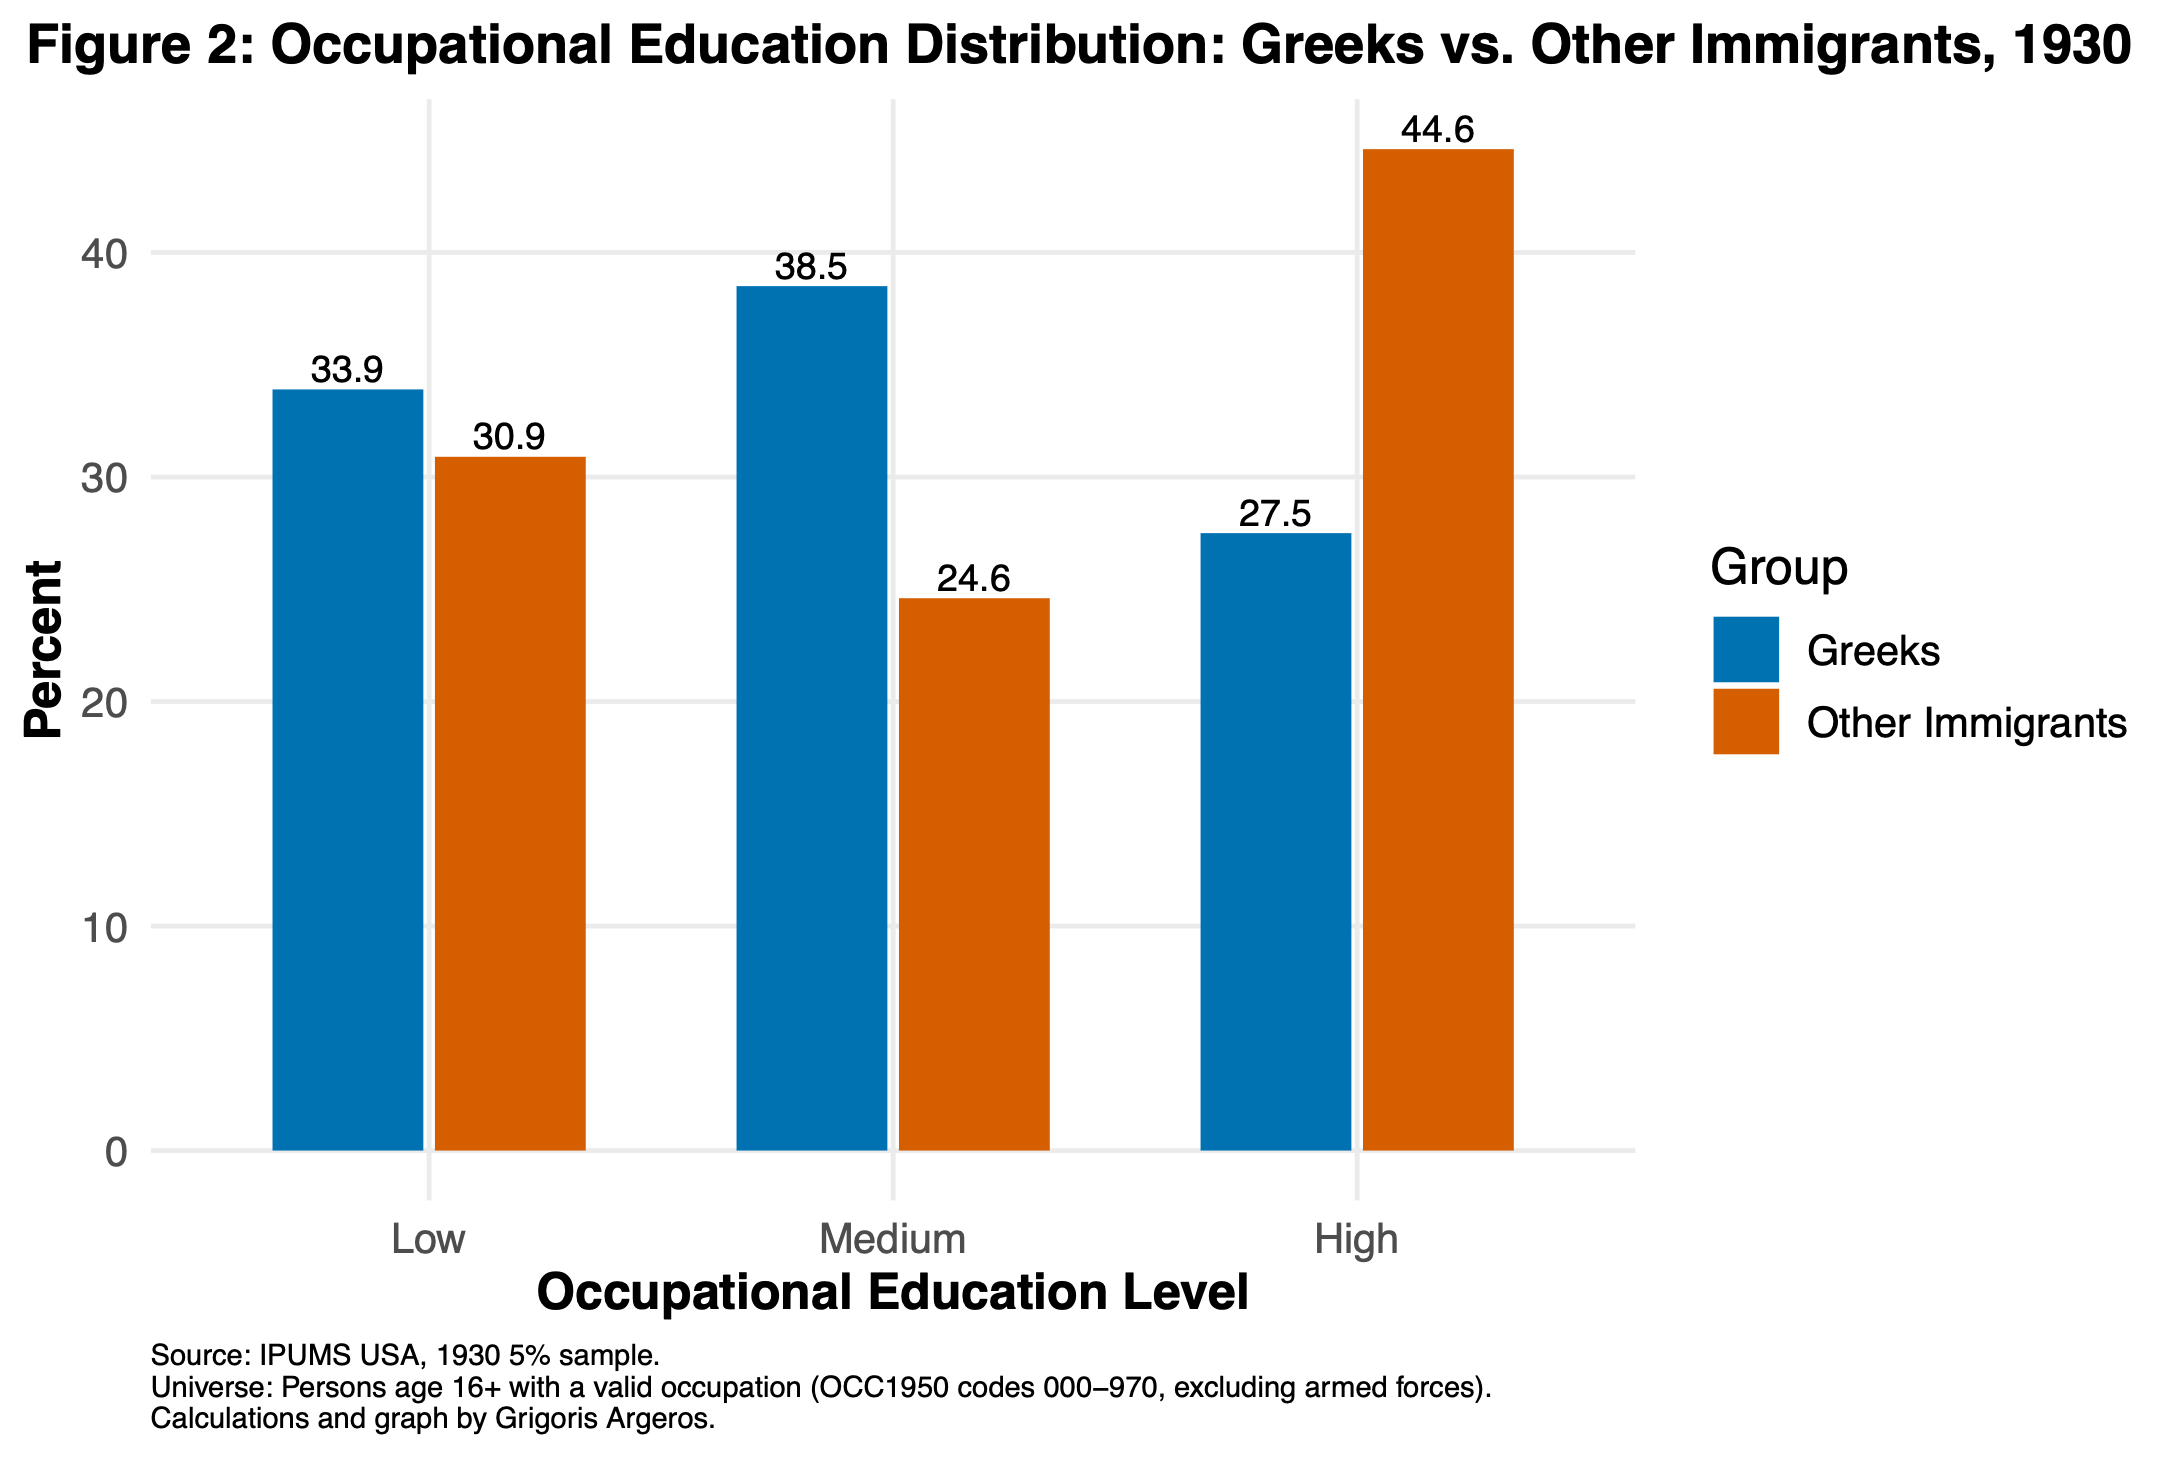
2. Occupational Education: Greeks in the Middle of the Ladder
Since the Census didn’t begin asking people about their educational attainment until 1940, I rely on a different indicator for 1930 that captures the typical educational attainment needed for a given occupation. The indicator is based on how much schooling people in that occupation usually had. In other words, it shows the share of workers in that job who had at least one year of college.
From Figure 2 below, we see:
- Greeks were much more likely to be in medium-skill occupations.
- Other immigrants were overrepresented in the highest-education occupations.
- About one-third of Greeks worked in lower-education jobs, similar to other immigrants.
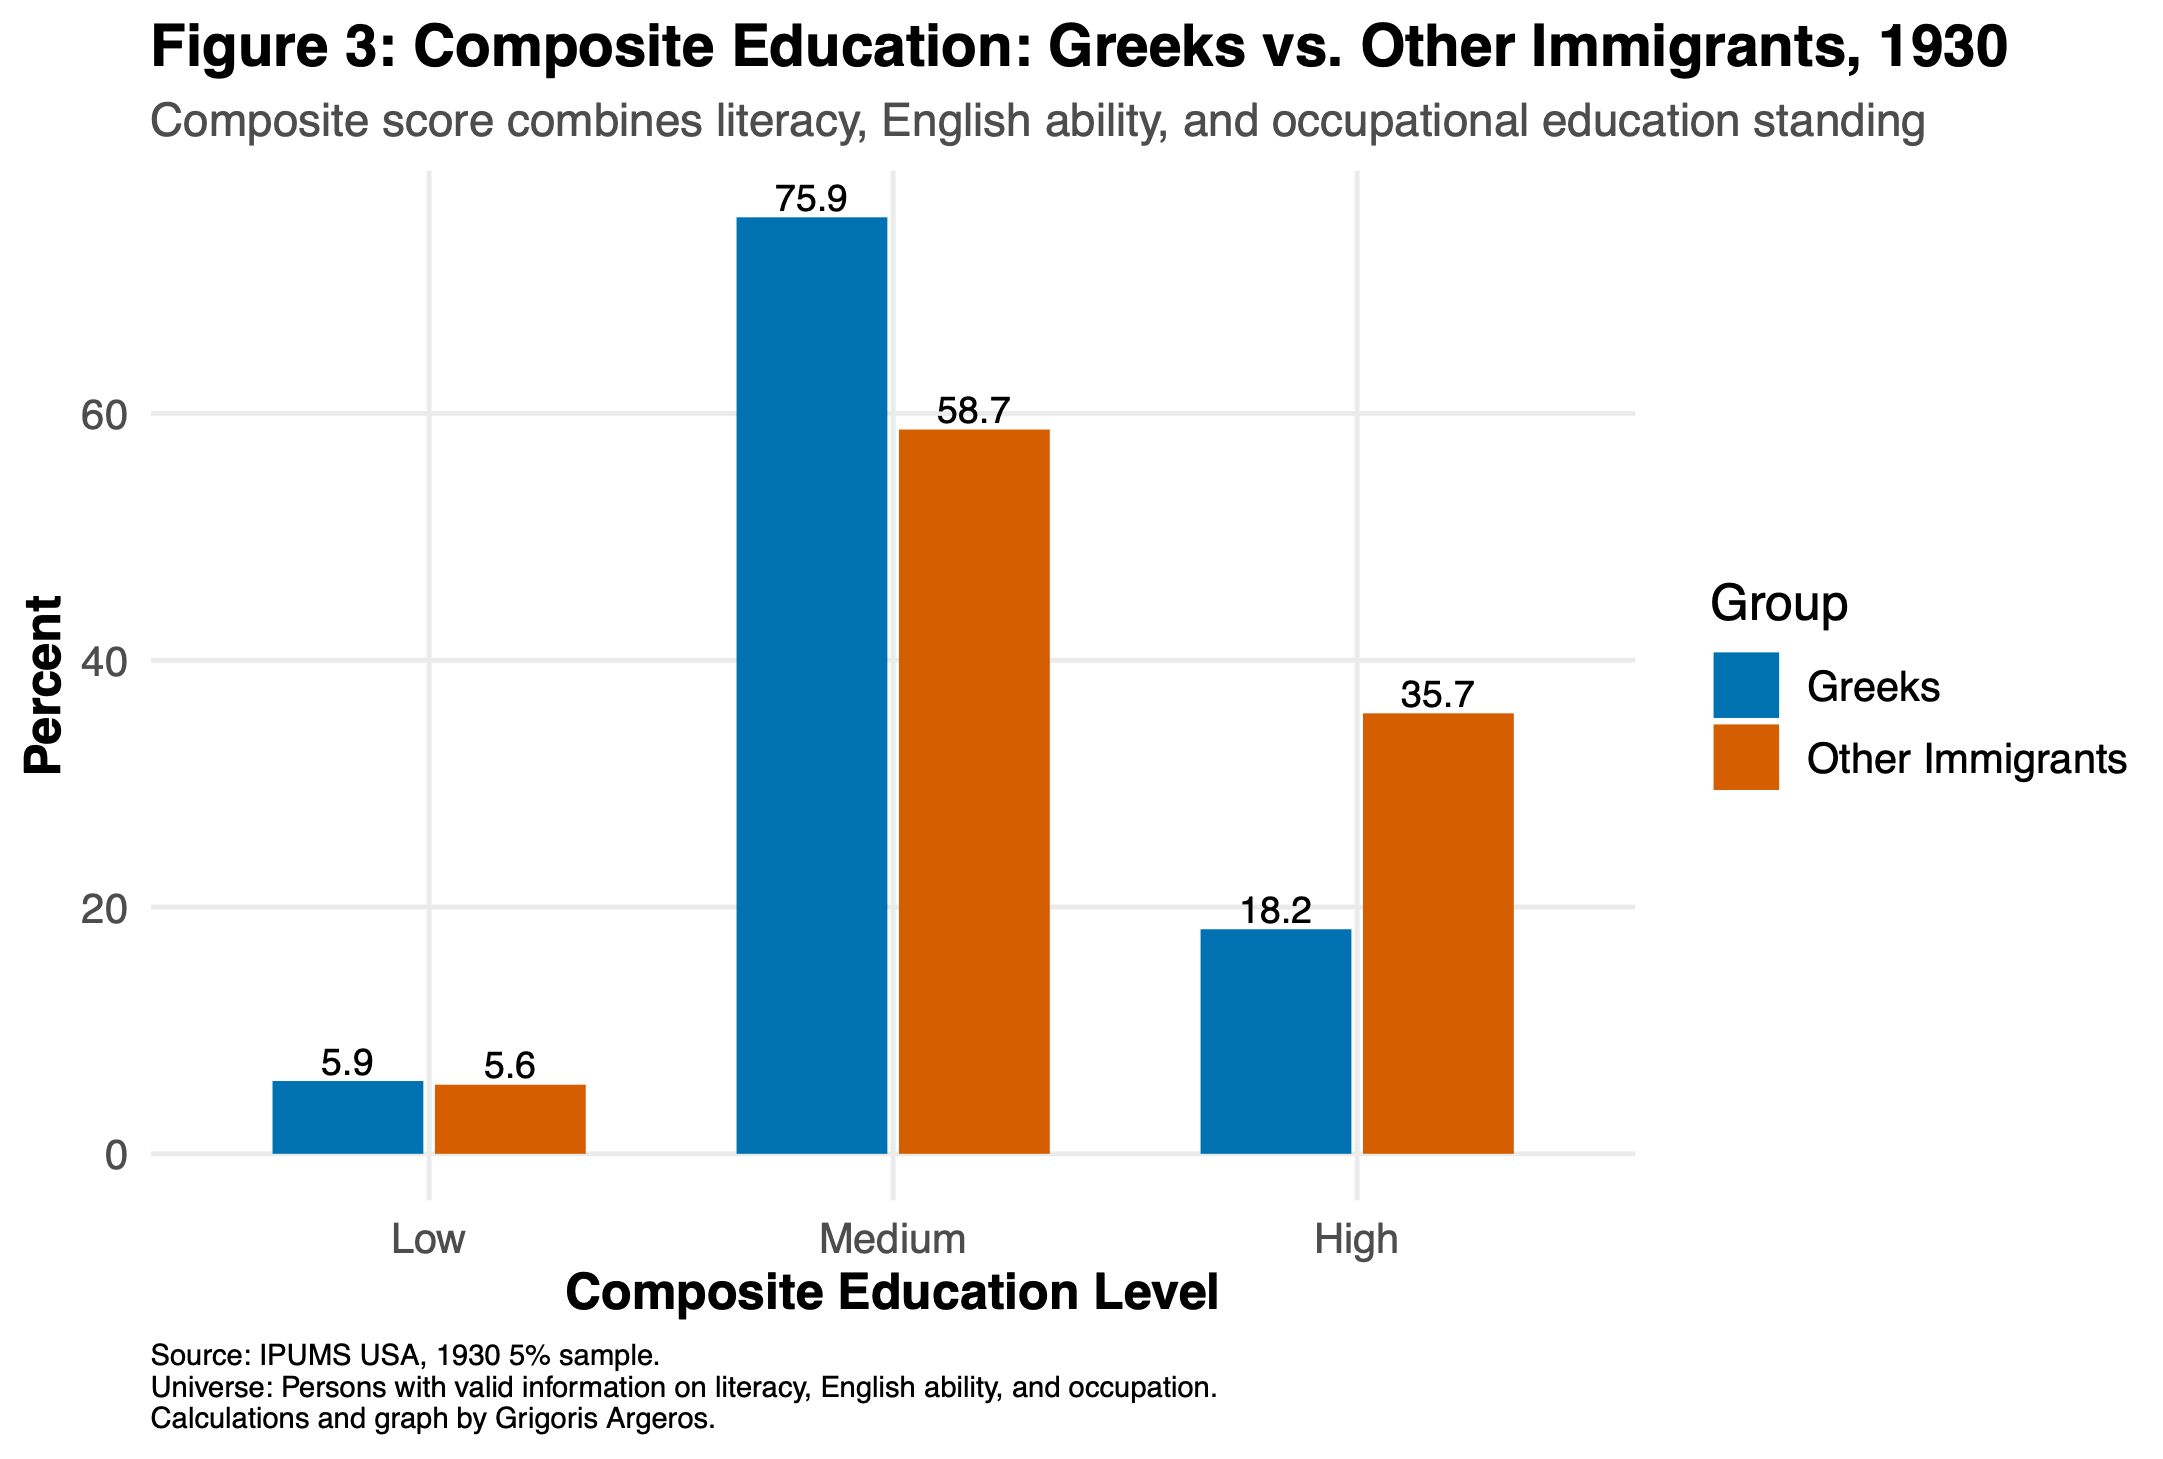
3. Composite Education: Literacy + English + Occupational Standing
To get a broader picture of where Greek immigrants stood in the overall educational hierarchy in 1930, I created a composite score combining literacy, English-language ability, and the typical educational level associated with each occupation. This last indicator is shown and discussed in the previous graph.
Overall, Greeks were in the middle of the pack, that is, neither at the bottom nor at the very top of the skill distribution. Most Greek immigrants were most likely to fall in the middle tier of this index, compared to other immigrant groups. Greeks and other immigrants were nearly equally distributed at the lower end. Still, at the higher end, a clear difference was evident: nearly twice as many non-Greek immigrants as Greek immigrants fell into the higher tier. See Figure 3 below.
4. Timing: Comparing 1890 - 1924 vs. Other Years
The final two figures, 4a and 4b, compare Greek immigrants who arrived in the US between 1890 and 1924 with Greek and non-Greek immigrants who arrived before 1930. According to Charles Moskos in his seminal book “The Greek Americans,” the 1890-1924 period represents the first wave of Greek immigration to the US. (Moskos 1999).
Figure 4a
Figure 4a (below) shows how the occupational education levels differ by year of arrival for both Greek immigrants and other immigrant groups. For each group, the figure compares those who arrived during the 1890 - 1924 period with those who arrived in other years before 1930.
For both Greek and non-Greek groups, those who immigrated to the US between 1890 and 1924 have lower shares in the higher-education occupations than their counterparts who immigrated in other years before 1930.
On the other hand, the reverse is true for the lower end of the hierarchy. That is, those immigrating to the U.S. between 1890 and 1924 have higher shares in the lower end than those who immigrated to the US in other years before 1930.
Within the middle tier, the 1890–1924 arrivals have the highest share, with Greek immigrants showing the highest overall share.

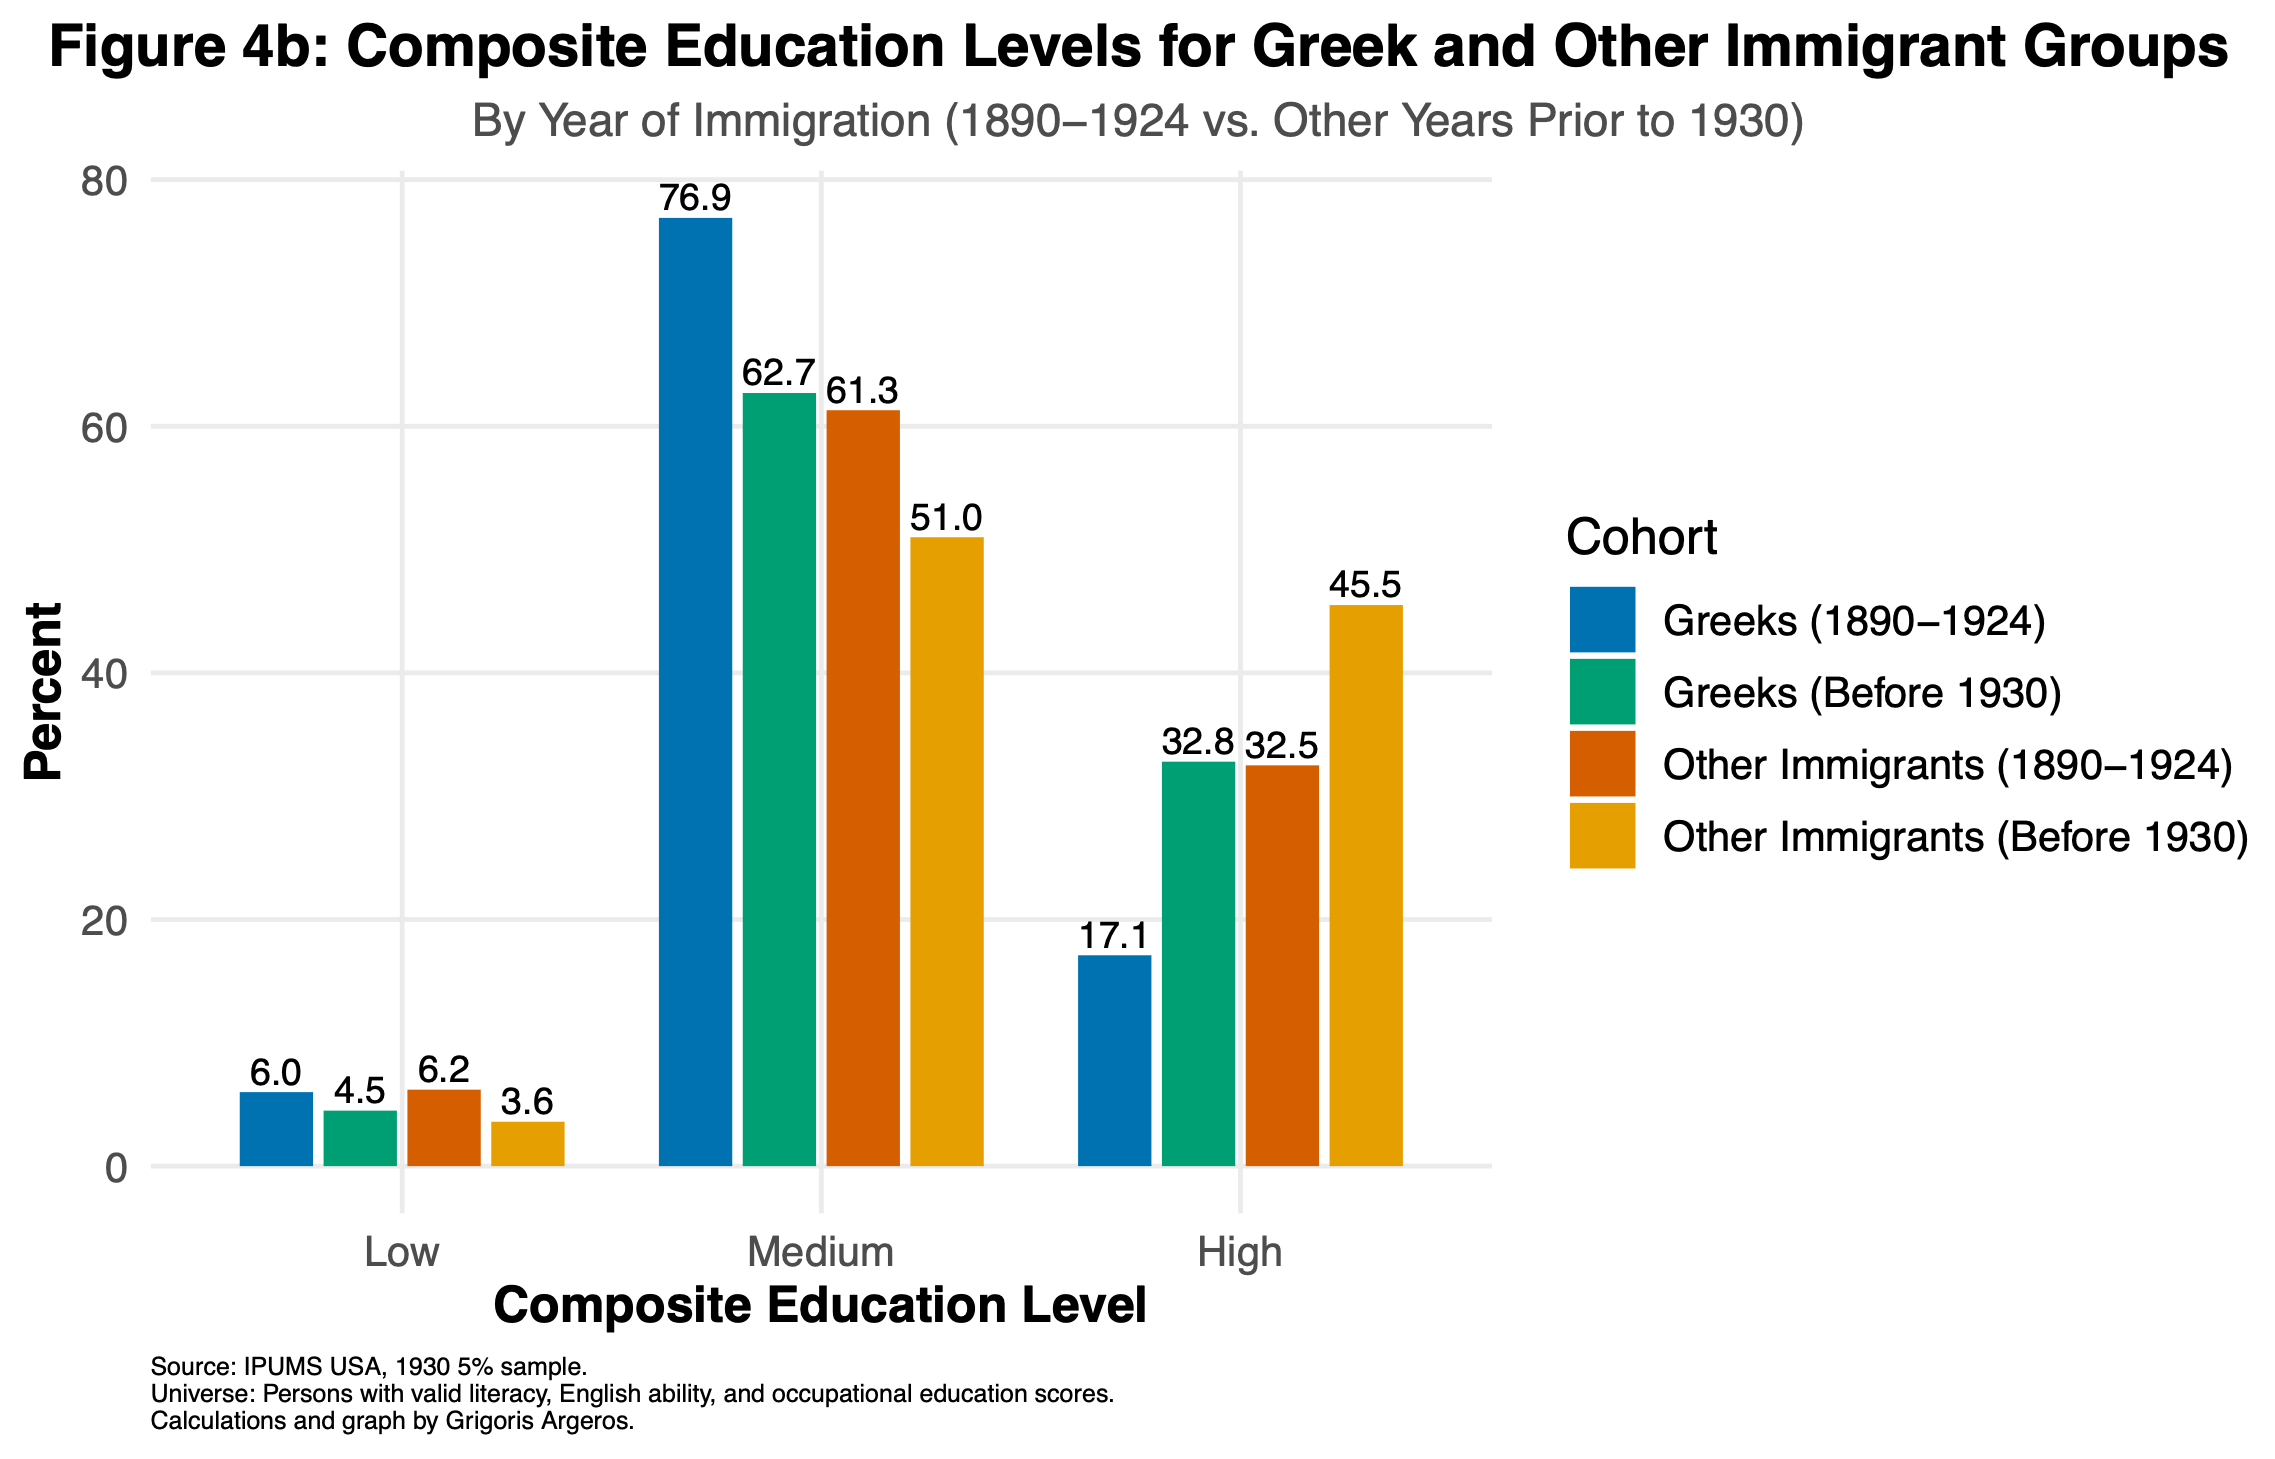
Figure 4b
Figure 4b (below) shows how immigrants' composite educational levels vary by year of arrival.
Similar to Figure 4a, both Greeks and other immigrants are split into two groups: those who arrived between 1890 - 1924, and those who arrived in other years before 1930.
Greeks who came between 1890 and 1924 are primarily concentrated in the middle tier, with much smaller shares in the high tier.
By comparison, Greeks who arrived in other years before 1930 have a different profile: they show a much larger share in the high composite tier and a smaller share in the low tier.
Other immigrant groups show a similar shift by arrival period, but the pattern is especially clear among Greeks.